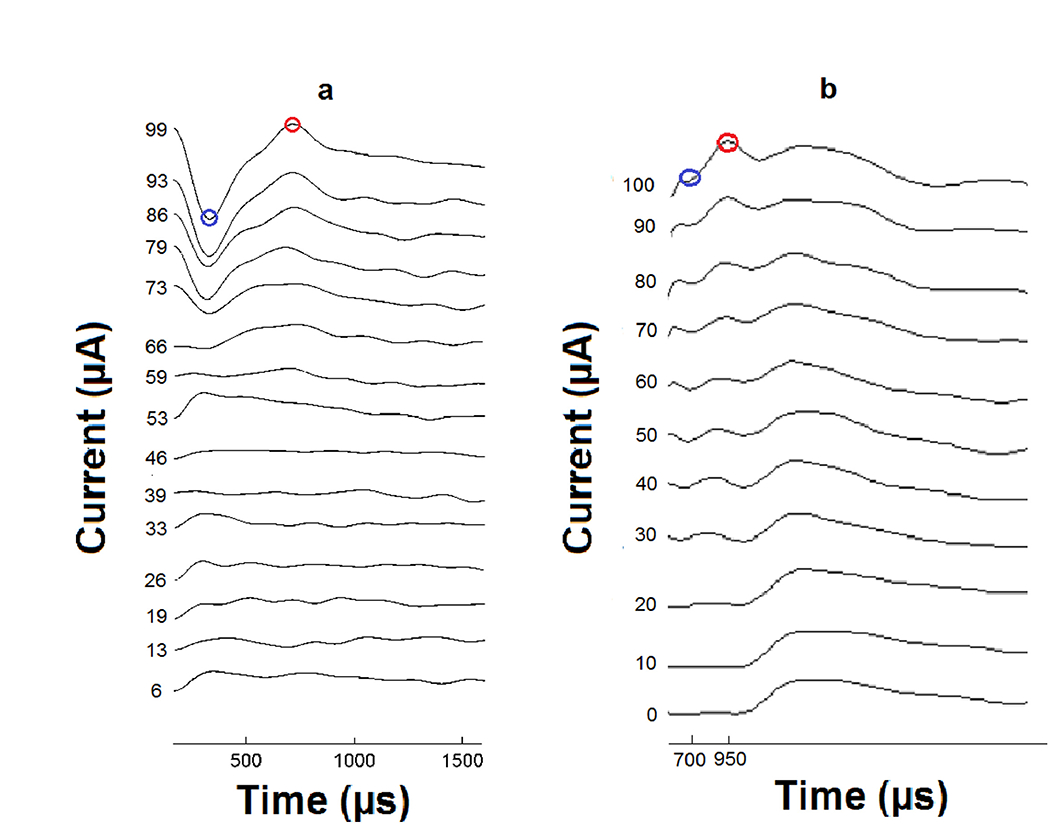
Figure 6.

Examples of an ECAP (a) and EABR (b) recording (electrical responses to stimuli recorded from the auditory nerve and brainstem, increasing with stimulus strength). N1 peaks are labeled in blue circles and P2 peaks are labeled in red circles. The N1 to P2 amplitudes in μV were plotted against stimulus current in μA to obtain input-output amplitude-growth functions. (a) For the ECAP recordings all peaks were selected by an automated custom program. When calculating slope of the ECAP AGFs, a linear regression was applied to fit all data points from 100 μV to the MSL, providing that the ECAP amplitudes continued to increase as a function of level. (b) For EABR recordings, all peaks were manually selected. When calculating slope of the AGFs for EABR, a linear regression was applied to fit all data points from 0.25 μV to the MSL, providing that the EABR amplitudes continued to increase as a function of level.
