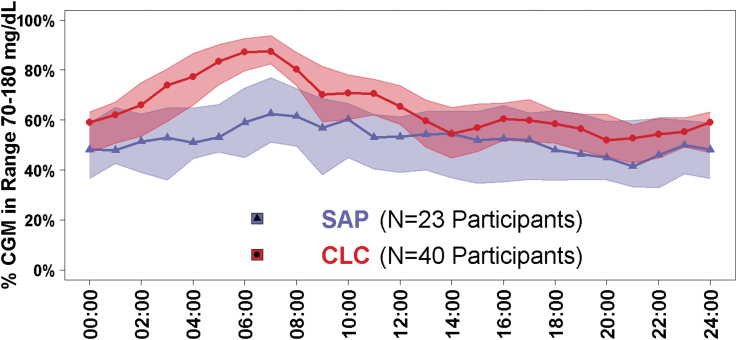
FIG. 1.
TIR by time of day and by treatment group. Blue triangles represent the SAP group, N = 23 participants. Red circles represent the CLC group, N = 40 participants. Lines with symbols denote hourly median values and the shaded regions are defined by the 25th and 75th percentiles. CLC, closed-loop control; SAP, sensor augmented pump; TIR, time in range.

