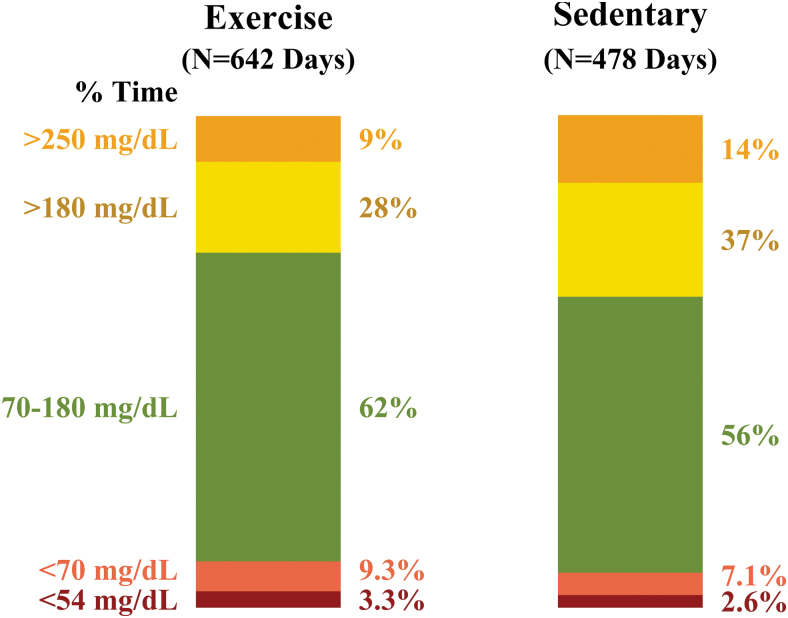
FIG. 1.
Stacked bar plot of average % time <54, <70, 70 to 180, >180, and >250 mg/dL on exercise versus sedentary days. Percent time <54 mg/dL is a subset of % time <70 mg/dL, while % time >250 mg/dL is a subset of % time >180 mg/dL. Due to skewed distribution, % time <70, <54, >180, and >250 mg/dL values were each censored at the 5th and 95th percentile. Color graphics are available online.

