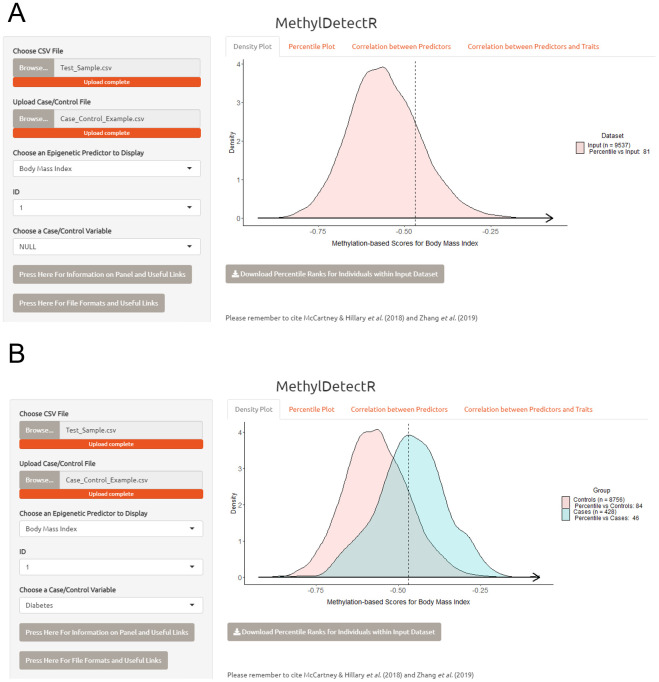
Figure 3. MethylDetectR Application – Panel 1.
( A) In the first panel, users can select a variable of interest and view how the methylation-based estimate for a chosen individual in the input dataset compares against the remainder of the input dataset (pink). ( B) The user can subset the scores according to case vs. control status for an uploaded binary phenotype of interest, such as disease status. Here, the distributions of DNAm-based scores for body mass index are plotted for diabetes cases (blue) and controls (pink). Percentile ranks for all individuals in the input dataset when compared against other members of the input dataset may be downloaded as a .csv file in this panel. Percentile ranks are reported for all traits in the output file with the exception of age which is reported in years.

