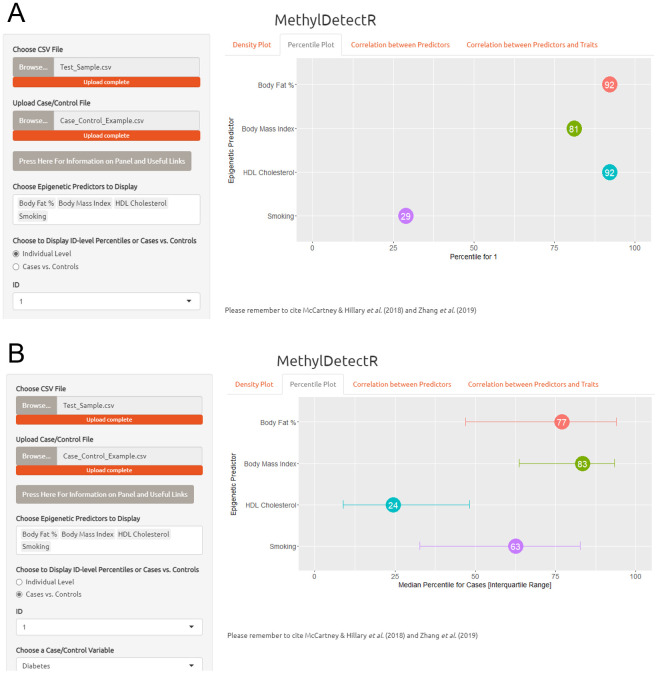
Figure 4. MethylDetectR Application – Panel 2.
( A) In the second panel, users can select multiple predictors of interest and simultaneously view the percentile rank for a selected individual in relation to these traits when compared against the remainder of the uploaded dataset. The percentile ranks dynamically update according to the selected age range and sex. ( B) The median percentile ranks for cases are plotted for selected traits of interest. The number shown in the circle reflects the median percentile, and the interquartile range of percentile ranks for cases is shown with the horizontal lines extending from the circle. Here, the median percentile ranks with respect to a number of physical traits are shown for cases of diabetes.

