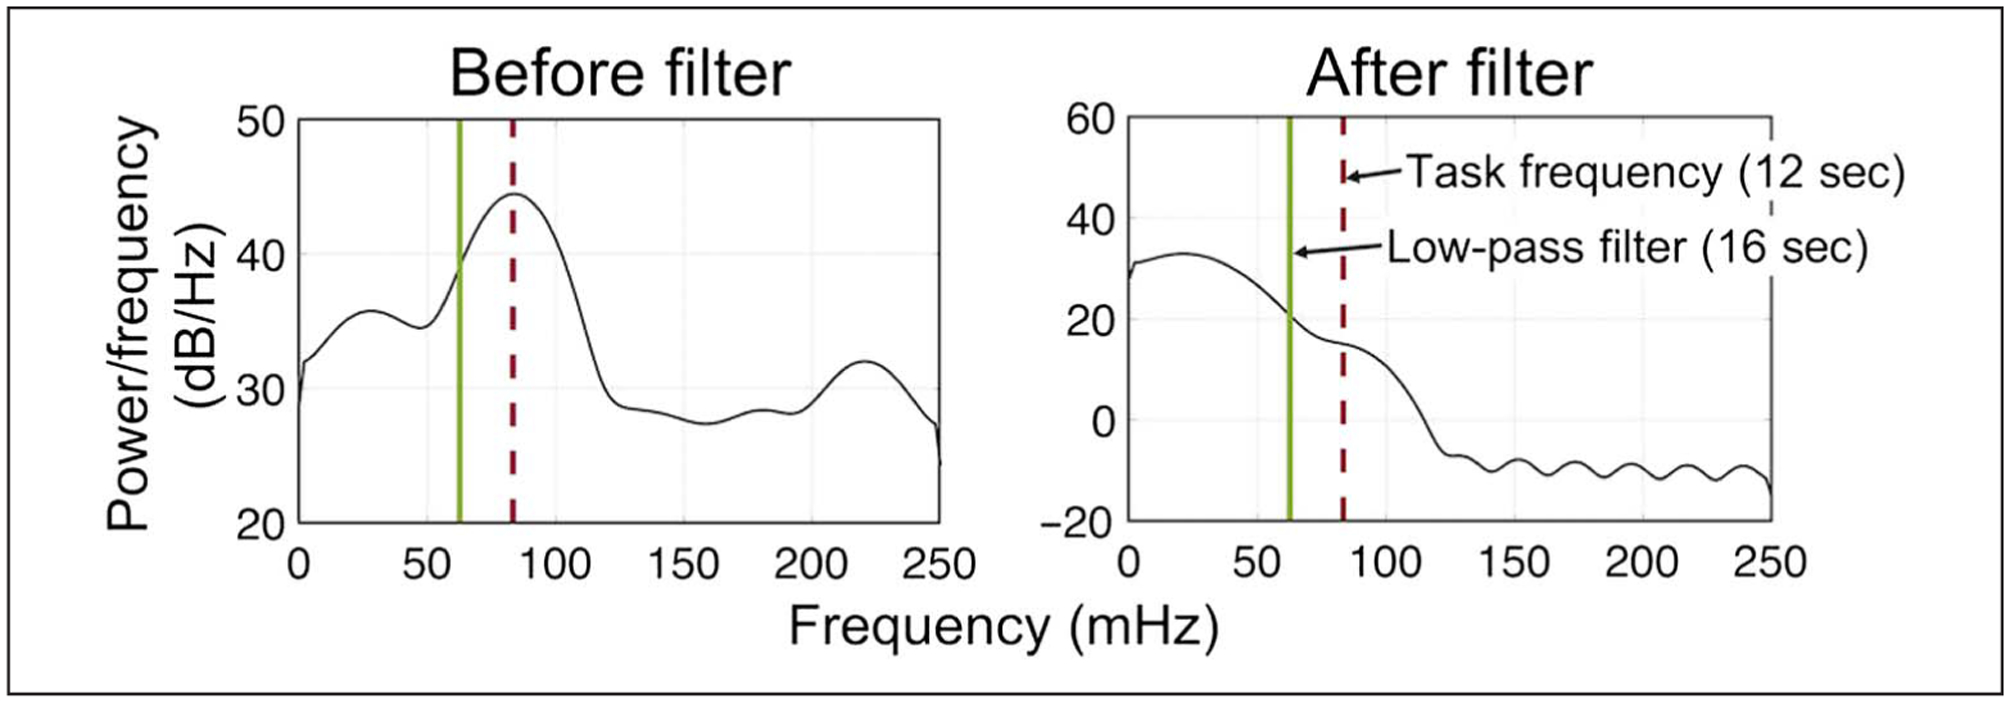
Figure 3.

Low-pass filter for measuring background connectivity. Left: Power spectrum of a lateral occipital cortex signal during the first run of categorization for an example participant before filtering shows a peak at task frequency (dashed line, 83 mHz = 12 sec). A conservative threshold of 62.5 mHz = 16 sec (solid line) was chosen for the low-pass filter to assure the removal of all task-related frequencies, as demonstrated by a disappearance of the peak at task frequency on the right panel.
