
Figure 2.
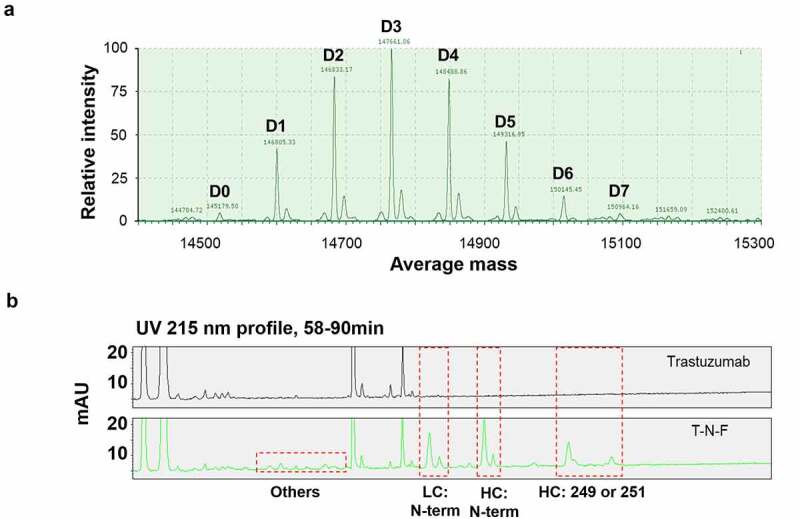
LC/MS analysis of NTERM conjugate. (a) DAR profile of T-N-F. T-N-F was analyzed using Waters Synapt G-2 system after deglycosylation reaction. Species with DAR 0–DAR 7 were observed and marked at D0–D7. The apparent DAR is 3.2 that is calculated as the weighted-average of DAR. (b) Conjugation sites were identified by peptide mapping. Trypsin-treated trastuzumab (top) and T-N-F (down) fragments mixture were resolved using an UPLC system with ACQUITY UPLC PST (BEH) C18 column
LC, liquid chromatography; MS, mass spectroscopy; DAR, drug-to-antibody ratio; T-N-F, trastuzumab-MMAF conjugate synthesized via NTERM conjugation reaction; UPLC, ultra-performance liquid chromatography.