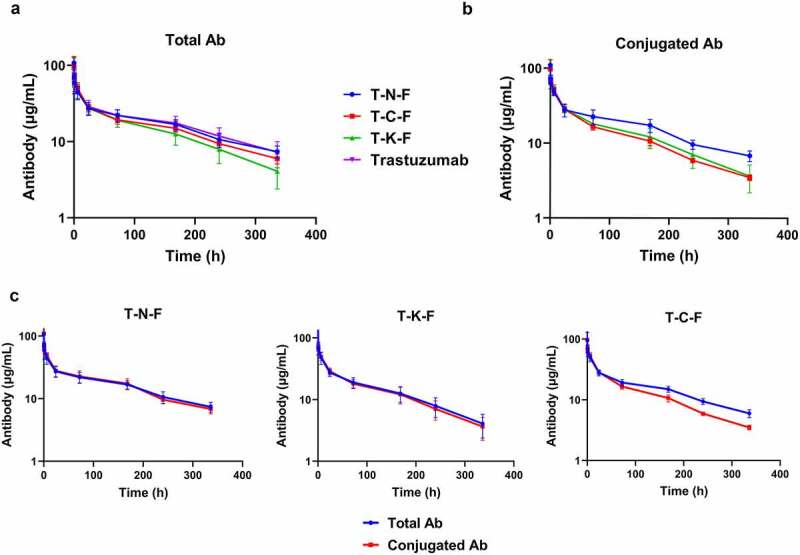
Figure 3.

Pharmacokinetic profile of ADCs, synthesized with different conjugation techniques, in rats at a single dose of 2.5 mg/kg. (a) Overview of the total antibody concentration of ADCs. (b) Overview of the conjugated antibody concentration. Blue line represents T-N-F, whereas T-C-F, T-K-F, and trastuzumab are represented by red, green and magenta lines, respectively. (c) Overview of the total and conjugated antibody concentration profiles of T-N-F (left), T-C-F (middle), and T-K-F (right). Blue lines denote total mAb and red lines represent ADC. N = 5 and the error bars represent standard error
ADCs, antibody–drug conjugates; T-N-F, trastuzumab-monomethyl auristatin F (MMAF) conjugate synthesized via NTERM conjugation; T-C-F, trastuzumab-MMAF conjugate synthesized via thiol conjugation; T-K-F, trastuzumab-MMAF conjugate synthesized via lysine conjugation; mAb, monoclonal antibody.
