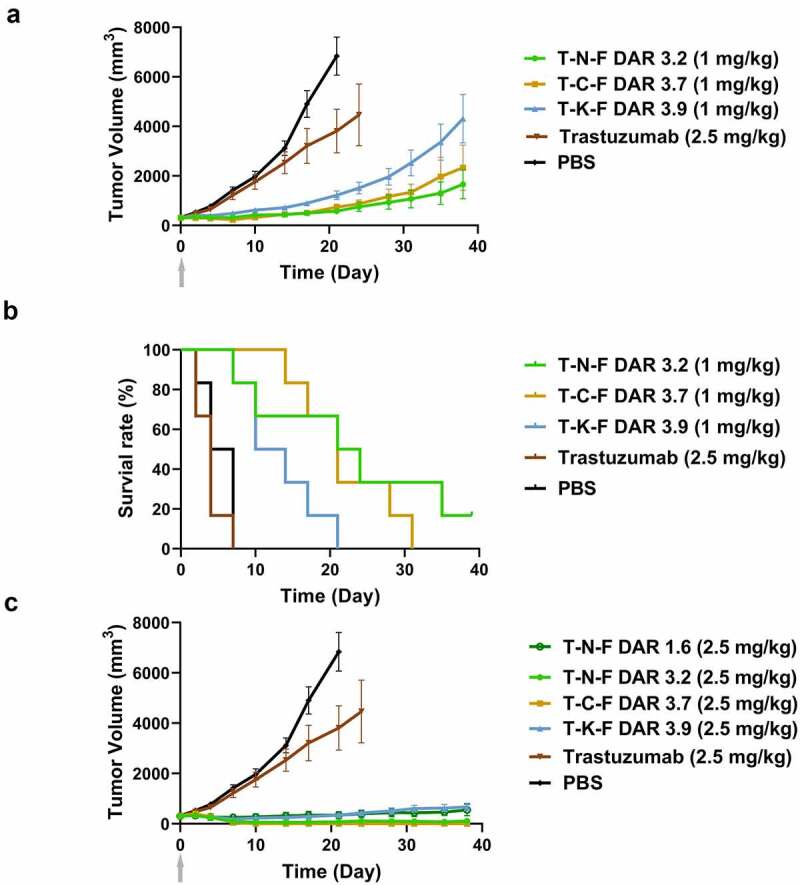
Figure 5.

In vivo efficacy of ADCs in nude rat xenograft model. (a) Tumor growth curves of 1 mg/kg ADC-treated groups and PBS- or trastuzumab-treated groups. Tumor volume was calculated as 0.5 × (longest axis) × (shortest axis)2. N = 6, and the error bar represents the standard error. (b) Survival plots of 1 mg/kg ADC-treated groups and the control groups. Animals were removed from the study when their tumor size became 200%. (c) Tumor growth curve of 2.5 mg/kg ADC-treated groups. A single dose was intravenously injected on day 0
ADC, antibody–drug conjugate; PBS, phosphate-buffered saline.
