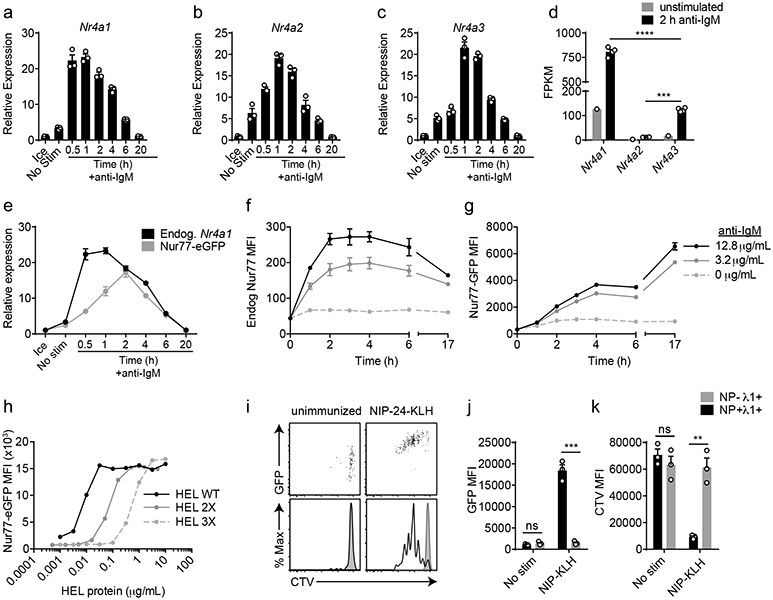
Figure 1. NUR77/Nr4a1 expression scales with BCR stimulation in vitro and in vivo.

A-C, E. Lymphocytes from NUR77-EGFP BAC Tg mice were stimulated with 10 μg/mL anti-IgM for the indicated times. qPCR was performed to determine relative expression of Nr4a1, Nr4a2, Nr4a3, and EGFP transcript. These and all subsequent qPCR data were normalized within each sample to Gapdh and further normalized to the unstimulated ice sample in each graph using the ddCT method.
D. B cells from WT mice were purified by bench-top negative selection from pooled splenocytes and LNs, stimulated with 10 μg/mL anti-IgM for 2 h, flash frozen and sent to Q2 Solutions for RNA sequencing. Displayed is the FPKM of Nr4a1, Nr4a2 and Nr4a3. N=1 for the unstimulated conditions, and N=4 for the stimulated conditions. F-G. Splenocytes from NUR77-EGFP reporter mice were stimulated with the given doses of anti-IgM for the indicated times. Expression of endogenous NUR77 (F) and EGFP (G) in CD23+ B cells was assessed via flow cytometry. H. Lymphocytes from NUR77-EGFP reporter mice were incubated with soluble WT HEL, HEL 2X, and HEL 3X at serially diluted concentrations for 24 h. Expression of EGFP in B220+ B cells was assessed via flow cytometry. I-K. Splenocytes from B1-8i NUR77-EGFP mice were loaded with cell trace violet (CTV). 5x10⁶ cells were adoptively transferred into allotype marked CD45.1+ host mice that were subsequently immunized with 100μg NIP-KLH. Host splenocytes were harvested after 3 days, and CTV, EGFP, NP-binding and λ1 surface expression of donor B cells was assessed via flow cytometry. For I-K, black histogram and bars represent Ag-specific (NP+ λ1+) donor B cells; gray shaded histogram and bars represent non-Ag-specific (NP− + λ1+) control donor B cells. Data in this figure depict N=3 biological replicates for all panels except (D) as noted above. Mean +/− SEM displayed for all graphs. Statistical significance was assessed with one-way ANOVA with Tukey’s (D); two-tailed unpaired student’s t-test (J, K). **p<0.01, ***p<0.001, ****p<0.0001.
