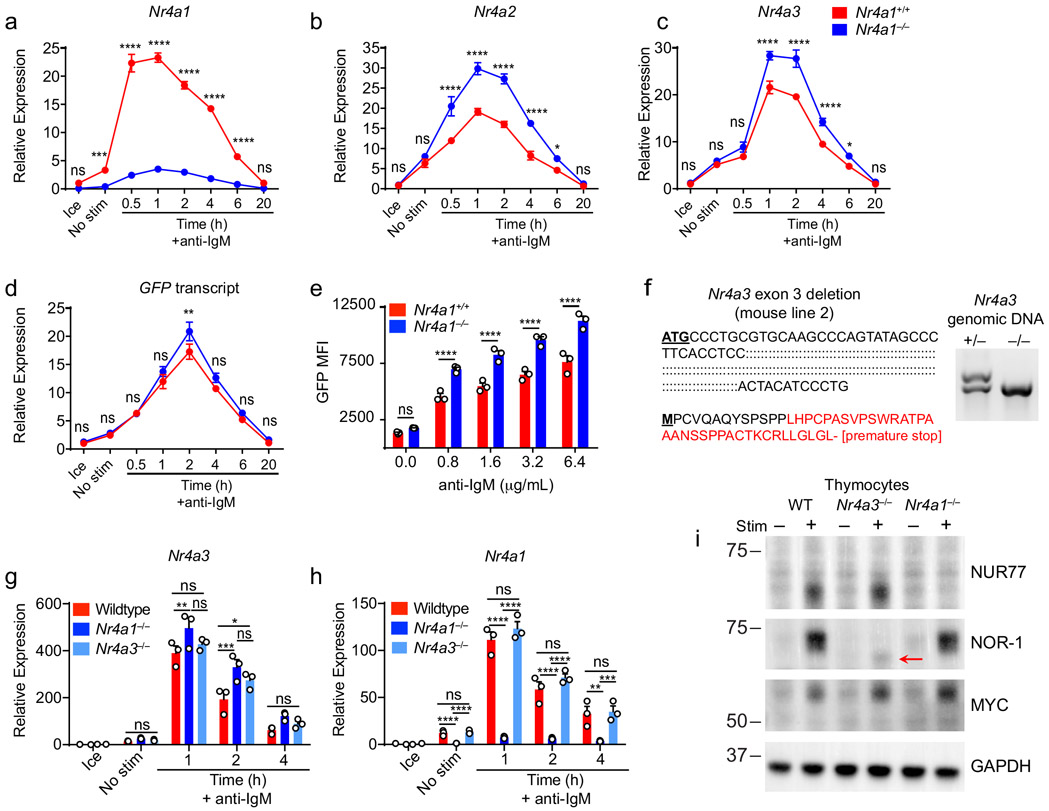
Extended Data Fig. 5. Compensatory expression of Nr4a genes in Nr4a1−/− B cells and generation of Nr4a3−/− mice.
A-D. Lymphocytes from Nr4a1+/+ and Nr4a1−/− mice harboring NUR77-EGFP BAC Tg were stimulated with 10 μg/mL anti-IgM for the indicated times. qPCR was performed to determine relative expression of Nr4a1, Nr4a2, Nr4a3, and GFP transcripts. Samples were also subjected to surface staining in parallel to detect % B cells via flow cytometry. Mean % B cells for Nr4a1+/+ samples was 37.6 ± 0.15 (SEM), and for Nr4a1−/− samples was 33.5 ± 1.02 (SEM). N=3 biological replicates for all conditions. Nr4a1+/+ samples correspond to data in Figs 1A-C. E. Lymphocytes from reporter Nr4a1+/+ and Nr4a1−/− mice were stimulated with the given doses of anti-IgM for 24 h. Graph depicts GFP MFI in B cells as determined by flow cytometry.
F. Left: Schematic showing the extent of nucleotide deletion in exon 3 of the Nr4a3 gene harboring ATG translation initiation site, resulting in the introduction of a premature stop codon. Right: Representative PCR showing absence of the WT Nr4a3 gene and the presence of a truncated product in Nr4a3−/− mice.
G, H. MACS-purified B cells from Nr4a1+/+, Nr4a1−/−, and Nr4a3−/− splenocytes were stimulated with 10 μg/mL anti-IgM for the indicated times. qPCR was performed to determine relative expression of Nr4a3 (G) and Nr4a1 (H) transcripts. I. Thymocytes from WT, Nr4a1−/− and Nr4a3−/− mice were incubated +/− PMA and ionomycin for 2 h. Subsequently whole cell lysates were blotted with Ab to detect NUR77, NOR-1, MYC, and GAPDH. Red arrow indicates presence of low abundance truncated NOR-1 protein in Nr4a3−/− mice. Graphs in this figure depict N=3 biological replicates for all panels. Mean +/− SEM displayed for all graphs. Statistical significance was assessed with two-tailed unpaired student’s t-test with Holm-Sidak (A-E); two-way ANOVA with Tukey’s (G, H). *p<0.05, **p<0.01, ***p<0.001, ****p<0.0001

