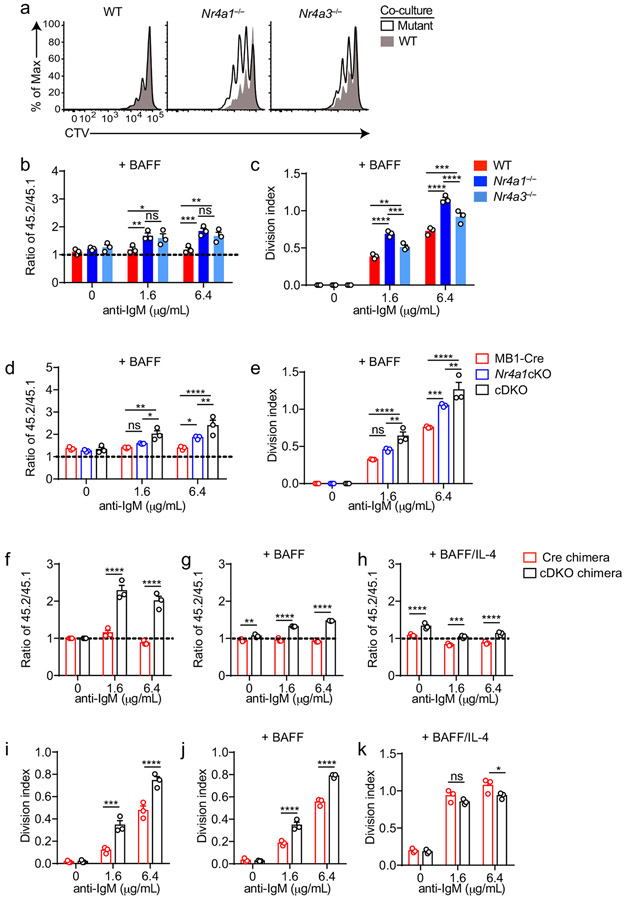
Extended Data Fig. 7. NUR77/Nr4a1 and NOR-1/Nr4a3 redundantly restrain BCR-induced B cell expansion.
A-C. Samples correspond to those described in Fig 5E, F. A. Histograms depict CTV dilution in CD45.2+ B cells (black histogram) and co-cultured CD45.1 WT B cells (shaded gray histogram), and are representative of at least 3 mice/genotype. B. Shown is the ratio of CD45.2+ WT, Nr4a1−/− or Nr4a3−/− B cells relative to co-cultured CD45.1+ WT B cells (+ 20 ng/ml BAFF), normalized to the unstimulated condition. C. Graph depicts division index for each genotype. D, E. Samples correspond to those described in Fig 5I, J, cultured in the presence of 20 ng/ml BAFF. D. Shown is the ratio of each CD45.2+ B cell genotype relative to co-cultured CD45.1+ WT B cells, normalized to the unstimulated condition. E. Graph depicts division index for each genotype. F-K. Competitive bone marrow chimeras were generated as described in Extended Data Fig 5H, I. 10-12 weeks after reconstitution, lymphocytes were harvested from chimeras, CTV loaded and cultured with given stimuli (anti-IgM doses +/− 20 ng/ml BAFF +/− 10 ng/ml IL-4). N=5 chimeras of each genotype were analyzed. F, G, H. Graphs depict ratio of CD45.2+ cre+ or cDKO B cells relative to CD45.1/2 WT B cells from each chimera, normalized to unstimulated condition. I, J, K. Graphs depict division index for CD45.2+ cre+ or cDKO B cells from each chimera. Graphs in this figure depict N=3 biological replicates for panels (D-E) except (F-K) as noted above which represent N=5 chimeras each. Mean +/− SEM displayed for all graphs. Statistical significance was assessed with two-way ANOVA with Tukey’s (B-E); two-tailed unpaired student’s t-test with Holm-Sidak (F-K). *p<0.05, **p<0.01, ***p<0.001, ****p<0.0001

