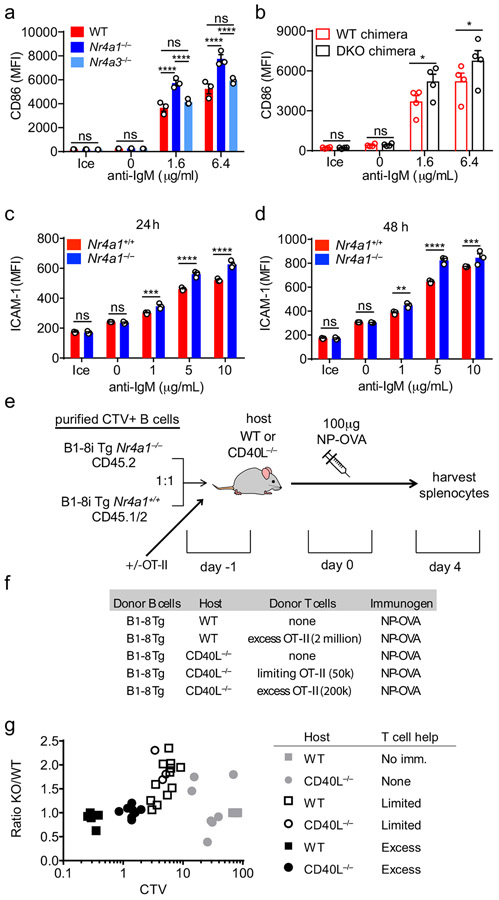
Extended Data Fig. 10. NUR77 modulates access to T cell help under competitive conditions.
A. Experiment performed as in Fig 6O. Graph depicts MFI of surface CD86 expression on B cells as determined via flow cytometry. B. Experiment performed as in Extended Data Fig. 8C with competitive chimeras described in Extended Data Fig. 6M, N. Graph depicts MFI of surface CD86 expression on B cells as determined via flow cytometry. C, D. Lymphocytes harvested from CD45.1+ Nr4a1+/+ and CD45.2+ Nr4a1−/− mice were mixed 1:1 and co-cultured with the given doses of anti-IgM for 24 h (C) or 48 h (D). Graphs depict MFI of ICAM-1 surface expression on each genotype of B cells as determined via flow cytometry. E, F. Schematic of adoptive transfer experimental design for Fig 8. B cells were purified from splenocytes harvested from Nr4a1+/+ B1-8 Tg CD45.1/2+ and Nr4a1−/− B1-8 Tg CD45.2+ mice via bench-top negative selection, mixed 1:1, and loaded with CTV. 2x10⁶-3x10⁶ B cells were then adoptively transferred +/− OTII splenocytes into either WT or CD40L−/− hosts. Host mice were then immunized IP one day later with 100 μg NP-OVA/alum, followed by spleen harvest on d4. G. Graph depicts adoptive transfer data from experiments described in E, F above and presented in Fig 8H with addition of unimmunized controls and CD40L−/− hosts that did not receive adoptive transferred OTII cells (shaded gray points). Data in this figure depict N=3 biological replicates except B (N=4) and G where individual biological samples are plotted. Mean +/− SEM displayed for all other graphs. Statistical significance was assessed with two-way ANOVA with Tukey’s (A); two-tailed unpaired student’s t-test with Holm-Sidak (B-D). *p<0.05, **p<0.01, ***p<0.001, ****p<0.0001

