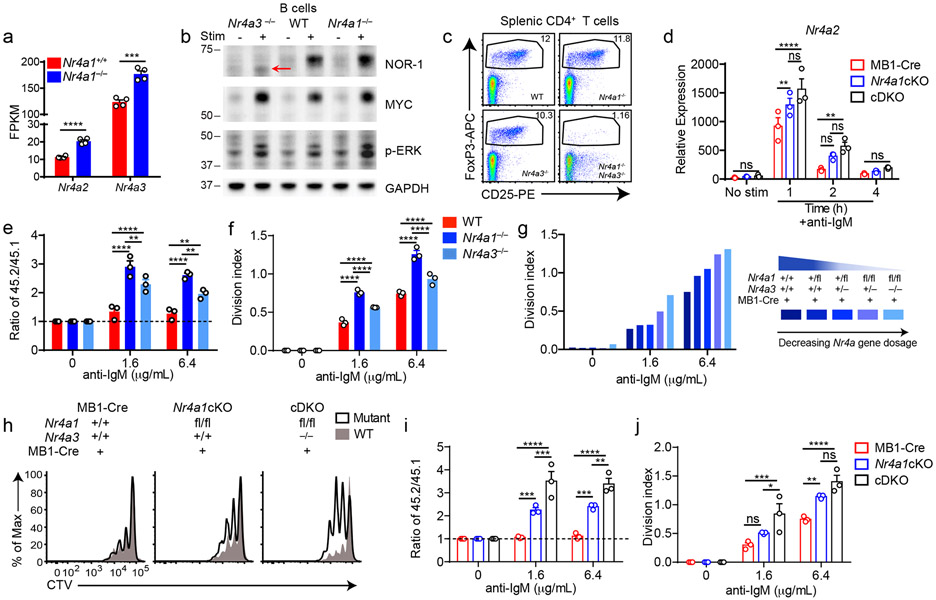
Figure 5. Conditional elimination of NR4A function in B cells reveals cooperative repression of BCR-induced B cell expansion.
A. Purified B cells from Nr4a1+/+ and Nr4a1−/− mice were stimulated for 2 h with 10 μg/mL anti-IgM, and analyzed by RNAseq as described in Fig 1D and methods. Displayed is the FPKM of Nr4a2 and Nr4a3. N=4. B. Purified B cells from WT, Nr4a1−/− and Nr4a3−/− mice were incubated +/− PMA and ionomycin for 2 h. Subsequently whole cell lysates were blotted with Ab to detect NOR-1, MYC, pERK, and GAPDH. Red arrow indicates presence of low abundance truncated NOR-1 protein. C. Representative flow plots show gated splenic Treg cell population in WT, Nr4a1−/−, Nr4a3−/− and Nr4a1−/− x Nr4a3−/− mice, as determined by CD25 expression and intra-cellular staining for Foxp3 in splenic CD4+ T cells. Plots are representative of 5 biological replicates. D. Different genotypes are defined as the following: mb1-cre: mb1-cre mice; Nr4a1cKO: mb1-cre x Nr4a1 fl/fl; cDKO: mb1-cre x Nr4a1fl/fl x Nr4a3−/−. Purified B cells were isolated from whole lymph node via MACs purification, and stimulated for the indicated times with 10 μg/mL anti-IgM. Relative Nr4a2 transcript was determined via qPCR.
E, F. Lymphocytes from CD45.2+ WT, Nr4a1−/−, and Nr4a3−/− mice were each mixed in a 1:1 ratio with CD45.1+ lymphocytes, CTV loaded and co-cultured in the presence of indicated doses of anti-IgM for 72 h. Cells were then stained to detect CD45.1, CD45.2, B220 and CTV via flow cytometry. E. Shown is the ratio of WT, Nr4a1−/− or Nr4a3−/− B cells relative to co-cultured CD45.1+ WT B cells, normalized to the unstimulated condition. F. Graph depicts division index for each genotype. G. An allelic series was generated by crossing Nr4a3−/−, mb1-cre and Nr4a1fl/fl lines to generate mice with a varying number of functional NR4A alleles, as indicated by the legend to the right. Lymphocytes were prepared and co-cultured as described for E, F above. Graph depicts division index plotted for N=1 mouse/genotype and is representative of 3 independent experiments. H-J. Different genotypes are defined as in D, above. Lymphocytes were prepared and co-cultured as described for E, F above. H. Histograms depict CTV dilution as described for B above and are representative of at least 3 mice/genotype. I. Shown is the ratio of each B cell genotype relative to co-cultured CD45.1+ WT B cells, normalized to the unstimulated condition. J. Graph depicts division index for each genotype.
Graphs in this figure depict N=3 biological replicates for all panels except (A) and (G) as noted above. Mean +/− SEM displayed for all graphs. Statistical significance was assessed with two-tailed unpaired student’s t-test without correction (A); two-way ANOVA with Tukey’s (D, E, F, I, J). *p<0.05, **p<0.01, ***p<0.001, ****p<0.0001

