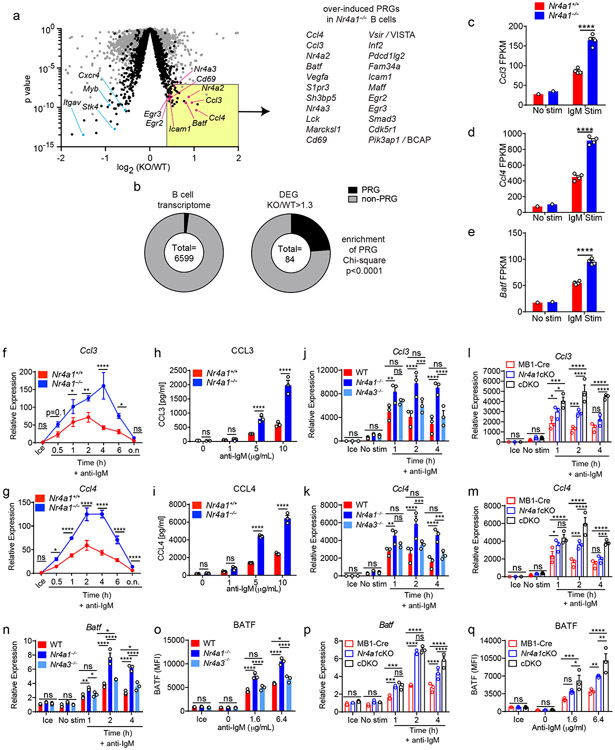
Figure 6. NUR77/Nr4a1 restrains a subset of BCR-induced primary response genes.
A-E. B cells from Nr4a1+/+ and Nr4a1−/− mice were purified by bench-top negative selection from pooled splenocytes and LNs, stimulated with 10 μg/mL anti-IgM for 2 h, flash frozen and sent to Q2 Solutions for RNA sequencing. N=1 for the unstimulated conditions, and N=4 for the stimulated conditions. A. Differentially expressed genes following 2 h anti-IgM stimulation and associated p values were identified via EdgeR pipeline. Gray points depict p value v log2FC for all genes, while black points depict genes filtered for log2CPM > 4. Gene list depicts all PRGs that are over-induced among Nr4a1−/− B cells relative to Nr4a1+/+ B cells with FC >= 1.3, p-value < 10−7, and log2CPM > 4. For broad identification of both immediate-early and delayed-early genes, PRG here are defined as BCR stim/unstim > 2 after 2 h. For complete list of filtered and unfiltered DEG, see Supplemental Data 1. B. EdgeR output was used to identify DEG with FC>= 1.3 and p value <= 0.05, and log2CPM > 4 was used to filter both B cell transcriptome and DEG list. Reference PRG list was derived from GSE61608 data set (genes induced > 5 fold with BCR stimulation at 2 h). Enrichment of this PRG set among genes that are over-induced in Nr4a1−/− B cells relative to Nr4a1+/+ B cells was plotted and assessed for significance via two-tailed Chi-square test. C-E. Displayed is the FPKM of Ccl3, Ccl4, and Batf. F, G. Lymphocytes from Nr4a1+/+ and Nr4a1−/− mice harboring NUR77-EGFP BAC Tg were stimulated with 10 μg/mL anti-IgM for the indicated times. qPCR was performed to determine relative expression of Ccl3 (G) and Ccl4 (H) transcripts. Samples correspond to those described in Extended Data Fig 5A-C. H, I. B cells from Nr4a1+/+ and Nr4a1−/− mice were purified by bench-top negative selection from pooled splenocytes and LNs, stimulated with given doses of anti-IgM for 48 h, and supernatant was analysed via ELISA to determine concentration of CCL3 (H) and CCL4 (I). J, K. B cells from Nr4a1+/+, Nr4a1−/−, and Nr4a3−/− mice were purified by bench-top negative selection from pooled splenocytes, and were stimulated with 10 μg/mL anti-IgM for the indicated times. qPCR was performed to determine relative expression of Ccl3 (J) and Ccl4 (K) transcripts. L, M. Experiment performed as in J, K except with purified B cells from genotypes: mb1-cre; mb1-cre x Nr4a1 fl/fl (“Nr4a1cKO”); mb1-cre x Nr4a1 fl/fl x Nr4a3−/− (“cDKO”). qPCR was performed to determine relative expression of Ccl3 (L) and Ccl4 (M) transcripts. N. Purified, stimulated B cell samples described in J, K subjected to qPCR to determine relative expression of Batf transcript. O. Lymphocytes were harvested from WT, Nr4a1−/−, and Nr4a3−/− mice, mixed in a 1:1 ratio with CD45.1 WT lymphocytes, and stimulated with the given doses of anti-IgM for 24 hours. Graph depicts MFI of intracellular BATF protein expression in CD45.2 B cells as determined via flow cytometry. P. Purified, stimulated B cell samples described in L, M subjected to qPCR to determine relative expression of Batf transcript. Q. Experiment performed as in (O) except with genotypes listed. Graph depicts MFI of intracellular BATF protein expression in B cells as determined via flow cytometry. Data in this figure depict N=3 biological replicates for all panels except (A-E) as noted above. Mean +/− SEM displayed for all graphs. Statistical significance was assessed using the two-tailed exact test with multiple comparison correction via Benjamini-Hochberg method within the EdgeR pipeline (A), two-tailed Chi-square test (B), two-tailed unpaired student’s t-test with Holm-Sidak (C-I); two-way ANOVA with Tukey’s (J-Q). *p<0.05, **p<0.01, ***p<0.001, ****p<0.0001

