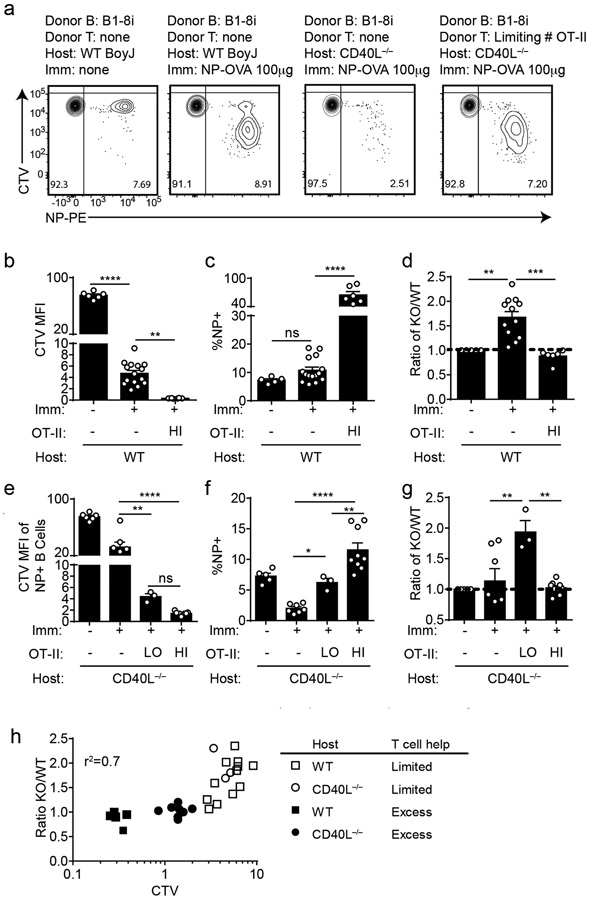
Figure 8. NUR77/Nr4a1 restrains B cell competition for T cell help under limiting conditions.
B cells were purified from splenocytes harvested from Nr4a1+/+ B1-8 Tg CD45.1/2+ and Nr4a1−/− B1-8 Tg CD45.2+ mice via bench-top negative selection, mixed 1:1, and loaded with CTV. 2x10⁶-3x10⁶ B cells were then adoptively transferred +/− OTII splenocytes into either WT or CD40L−/− hosts. Host mice were then immunized IP one day later with 100 μg NP-OVA/alum, followed by spleen harvest on d4. Schematic of experimental design is depicted in Extended Data Fig. 10A, B.
A. Representative flow plots gated on total donor B cells depict CTV dilution among NP-binding B cell under varied conditions. B-D. Adoptive transfers into WT hosts were performed as described above. Mice which excess T cell help (OTII: “HI”) received donor B cells co-transferred with 2x10⁶ OTII splenocytes Graphs depict CTV dilution among donor NP-binding B cells (B), expansion of NP-binding donor B cells (C), and ratio of Nr4a1−/− relative to Nr4a1+/+ donor NP-binding B cells normalized to the ratio in unimmunized hosts (D). N=5 unimmunized recipients, N=13 hosts that received only donor B cells, and N=6 hosts that received donor B cells mixed with excess OTII, pooled from a total of 3 independent experiments. E-G. Adoptive transfers into CD40L−/− hosts were performed as described above. Mice which received limited T cell help (OTII: “LO”) received donor B cells co-transferred co-transferred with 5x10⁴ splenocytes harvested from OTII mice, and mice which received excess T cell help (OTII: “HI”) received donor B cells co-transferred co-transferred with 2x10⁵ splenocytes. Graphs depict CTV dilution among donor NP-binding B cells (E), expansion of NP-binding donor B cells (F), and ratio of Nr4a1−/− relative to Nr4a1+/+ donor NP-binding B cells normalized to the ratio in unimmunized hosts (G). N=5 unimmunized recipients, N= 7 hosts that received B1-8 donor B cells only, N=3 hosts that received limited T cell help, and N=9 hosts that received excess OTII T cells, pooled from 3 independent experiments. H. Graph depicts correlation between ratio of Nr4a1−/− relative to Nr4a1+/+ donor NP-binding B cells (as plotted in D, G above) and CTV dilution of NP-binding donor B cells in individual recipients (as a proxy measure of T cell help). Mean +/− SEM displayed for all graphs. Biological replicates as described above. Statistical significance was assessed with one-way ANOVA with Tukey’s (B-D) or Sidak (E-G); Pearson correlation coefficient (H). *p<0.05, **p<0.01, ***p<0.001, ****p<0.0001

