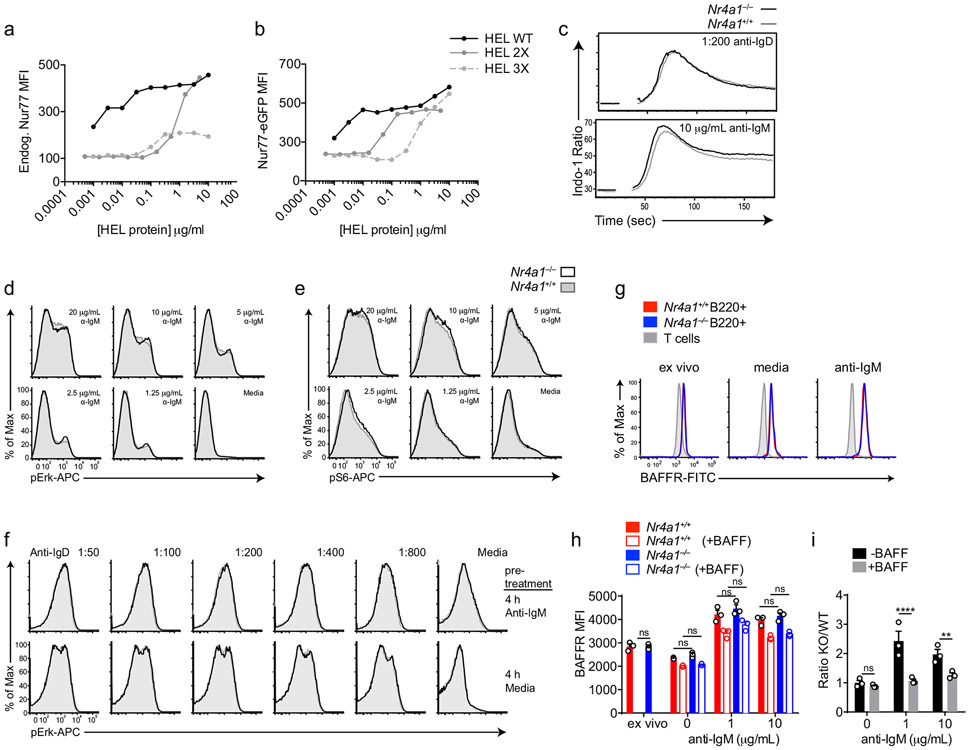
Extended Data Fig. 1. NUR77 does not alter proximal BCR signal transduction or BAFFR expression.
A, B. NUR77-EGFP lymphocytes were treated as in Fig 1H except for only 2 h. Endogenous NUR77 (A) and EGFP (B) in B220+ B cells was assessed via flow. C. Splenocytes from Nr4a1+/+ and Nr4a1−/− mice were loaded with Indo-1 dye and stained to identify CD23+ B cells. Samples were collected on a flow cytometer for 20s, and then for 3m following stimulation with either anti-IgM or anti-IgD. Intracellular calcium is depicted for CD23+ B cells. D, E. Splenocytes from Nr4a1+/+ and Nr4a1−/− mice were stimulated with anti-IgM for 5 m, fixed, permeabilized, and then stained for either pErk (B) or pS6 (C) followed by staining to identify CD23+ B220+ B cells. F. Splenocytes from CD45.1+ Nr4a1+/+ and CD45.2+ Nr4a1−/− mice were mixed 1:1, and then either stimulated with 10 μg/mL anti-IgM or media alone for 4 h. After stimulus wash-out and 15 m rest, cells were re-stimulated with anti-IgD for 5 m and processed as in B, C to detect intra-cellular pErk. G, H, I. Lymphocytes from CD45.1+ Nr4a1+/+ and CD45.2+ Nr4a1−/− mice were mixed 1:1 and co-cultured for 72 h with anti-IgM +/− BAFF 20ng/ml as described. Cells were then stained to detect CD45.1, CD45.2, B220, and BAFFR. G. Plots depict surface expression of BAFFR in B and T cells either ex vivo or after culture +/− anti-IgM. H. Graph depicts BAFFR MFI in B220+ B cells. I. Graph depicts ratio of CD45.2+ Nr4a1−/− relative to CD45.1+ Nr4a1+/+ B220+ B cells after 72 h culture normalized to input ratio. Data in C-F reflect N=2 biological replicates and in G-I reflect N=3 biological replicates. Mean +/− SEM displayed for all graphs. Statistical significance was assessed with two-way ANOVA with Tukey’s (H); two-tailed unpaired student’s t-test with Holm-Sidak (I). **p<0.01, ****p<0.0001

