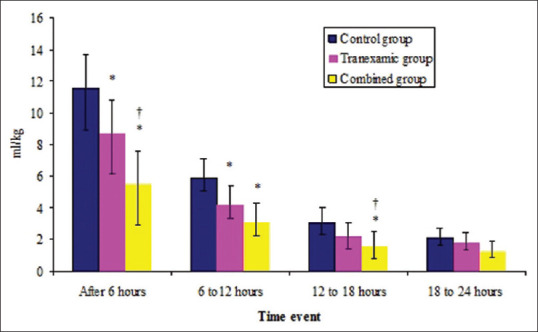
Figure 2.

Blood loss during the first postoperative 24 h. Data are expressed as mean ± standard deviation. P value was generated using repeated measure ANOVA. *P < 0.05 is significant when compared with the control group. †P < 0.05 is significant when compared with the tranexamic group
