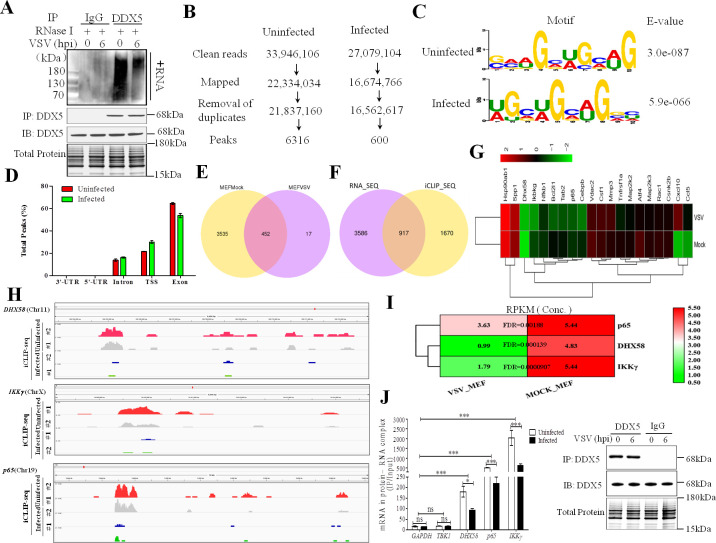
Fig 4. Analysis of DDX5-bound antiviral transcripts from VSV-infected MEFs by iCLIP-seq and RNA-seq technology.
A: Immunoblot of DDX46-bound biotin-labeled RNA by iCLIP based on IgG (control) or anti-DDX5 from MEFs infected for 0 or 6 h with VSV. RNA was treated with RNase I and transferred to a PVDF membrane. Biotin-labeled RNA was detected and visualized by the chemiluminescent nucleic acid detection module. The expression levels of indicated proteins were analyzed by western blotting. B: iCLIP-seq alignment and processing pipeline resulting in peaks. C: Consensus motif of DDX5-bound RNAs (identified by E values) of the multiple-sequence alignment with the greatest enrichment under significant iCLIP-seq peaks in transcripts from uninfected or VSV-infected MEFs. D: Frequency of total peaks under substantial iCLIP-seq date. UTR, untranslated region; TSS, transcriptional start site. E: Venn diagram of different peaks in transcripts from uninfected or VSV-infected MEFs. Significantly different peaks (p<0.05) were analyzed using iCLIP-seq. F: Venn diagram of transcripts with significantly different binding to DDX5 (p<0.05) and significantly different expression (p<0.05) in uninfected or VSV-infected MEFs that were analyzed via combined iCLIP-seq and RNA-seq. G: Heatmap of differential expression of innate immune-associated DDX5-bound transcripts after VSV infection. Differential expression of innate immune-associated DDX5-bound transcripts was generated from iCLIP-seq and RNA-seq data (p<0.01). H: Sequencing read clusters (tracks from the IGV visualization tool for interactive exploration of genomic data sets) from iCLIP analysis of DHX58, IKKγ, and p65 in uninfected or VSV-infected (MOI = 10) MEFs, above tracks, pre-mRNA genomic loci. I: Heatmap of DDX5-bound transcripts in uninfected or VSV-infected MEFs. DDX5-bound transcripts were acquired by iCLIP-Seq assay. Differences in DDX5-bound transcripts were assessed based on the RPKM value. FDR, false discovery rate. J: Abundance of GAPDH, TBK1, DHX58, IKKγ, and p65 transcripts in DDX5–RNA complexes was determined via co-IP of DDX5 and RNA (RNA-binding protein immunoprecipitation) from MEFs infected with VSV (MOI = 10) for 0 or 6 h. The expression levels of the indicated proteins were analyzed using western blotting. The results are presented relative to the control IP of protein–RNA with input (IP/input). All data are presented as mean ± SEM of biologically independent samples. Data are representative of three independent experiments. ns, no significant difference. *p<0.05, ***p<0.001 (Student’s t-test).

