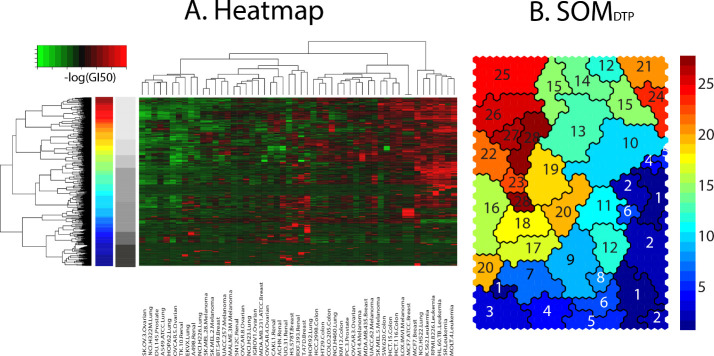
Fig 2. Panel A displays a heatmap of GI50codebook, colored spectrally from green(chemoinsensitive) to red(chemosensitive) response.
Dendrogram at the left represents hierarchical clustering (Euclidean, Ward’s) of GI50codebooks (reproduced from Fig 1 Panel D). Panel B displays the SOMDTP colored according to hierarchical cutree [18] specified at the optimal number of 28 meta-clades. The 28 colors appear spectrally from meta-clade 1 (dark blue), at the bottom of the hierarchical dendrogram, to meta-clade 28 (dark red), at the top of the hierarchical dendrogram. Grayscale bar adjacent to the 28 meta-clade spectrally colored bar displays the 7 meta-clades groupings. The NCI60 tumor cell lines clustered in the heatmap are ordered, left to right, as: SK.OV.3.Ovarian, NCI.H322M.Lung, DU.145.Prostate, A549.ATCC.Lung, HOP.62.Lung, OVCAR.5.Ovarian, TK.10.Renal, EKVX.Lung, A498.Renal, NCI.H226.Lung, SK.MEL.28.Melanoma, SK.MEL.2.Melanoma, BT.549.Breast, UACC.257.Melanoma, MALME.3M.Melanoma, SN12C.Renal, OVCAR.8.Ovarian, NCI.H23.Lung, IGROV1.Ovarian, MDA.MB.231.ATCC.Breast, OVCAR.4.Ovarian, CAKI.1.Renal, ACHN.Renal, UO.31.Renal, HS.578T.Breast, RXF.393.Renal, T.47D.Breast, HOP.92.Lung, HCC.2998.Colon, HT29.Colon, COLO.205.Colon, NCI.H460.Lung, KM12.Colon, PC.3.Prostate, OVCAR.3.Ovarian, M14.Melanoma, MDA.MB.435.Breast, UACC.62.Melanoma, SK.MEL.5.Melanoma, SW.620.Colon, HCT.15.Colon, HCT.116.Colon, LOX.IMVI.Melanoma, MCF7.ATCC.Breast, MCF7.Breast, NCI.H522.Lung, K.562.Leukemia, RPMI.8226.Leukemia, HL.60.TB..Leukemia, SR.Leukemia, MOLT.4.Leukemia, CCRF.CEM.Leukemia.

