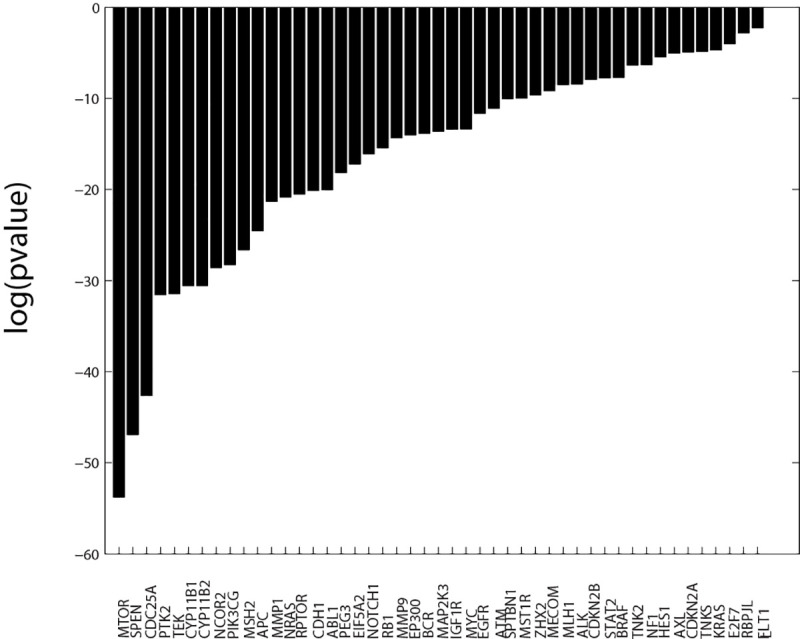
Fig 7. Fisher’s exact scores (log(pvalue), pvalue< = 0.05).

Results are based on classifications using up to the 10th best SOM projection nodes for FDA compounds. Forty-seven defective genes have significant Fisher’s exact scores when tested over the complete SOMDTP.
