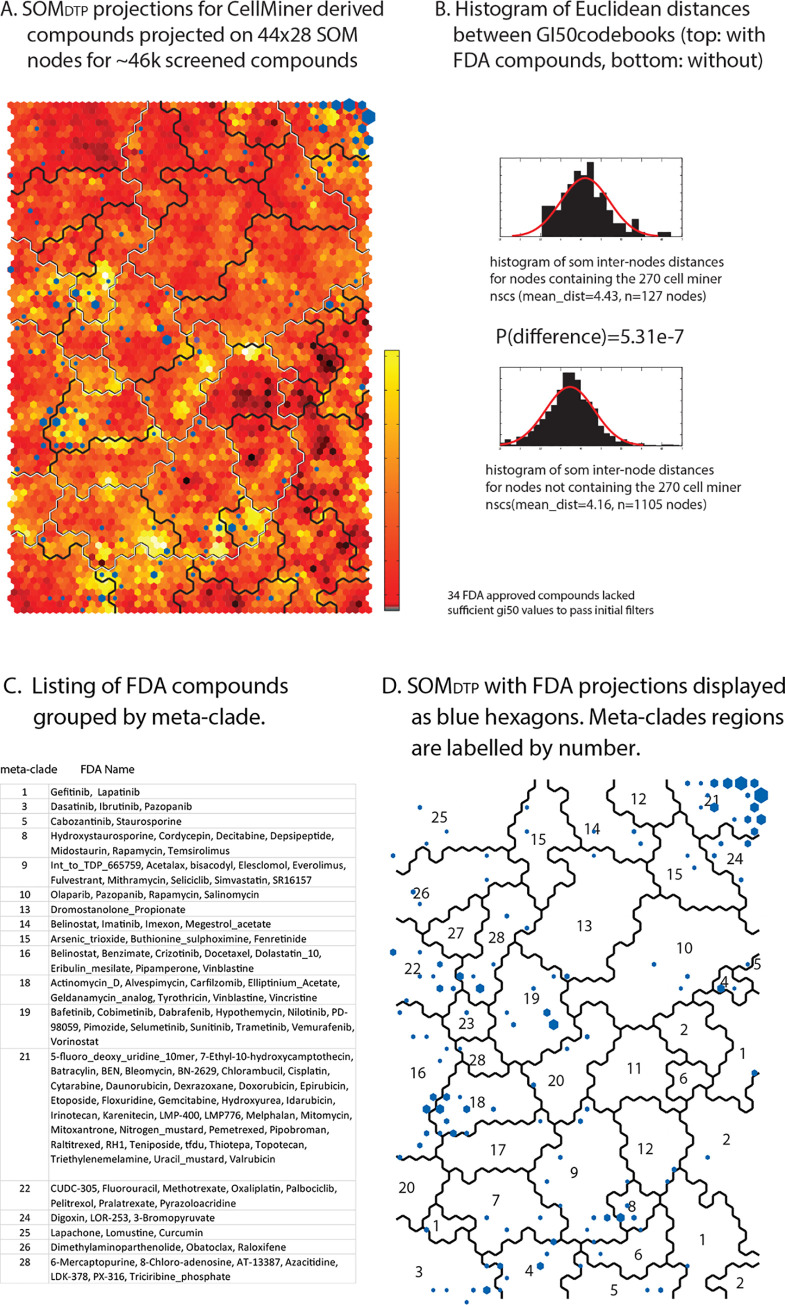
Fig 8. Panel A.
SOMDTP is colored according to similarity of GI50codebooks, where the most similar node neighbors are displayed in deep red and the most dis-similar node neighbors appear in bright yellow (see vertical bar adjacent to SOMDTP). The 28 optimal meta-clade boundaries are displayed as a black line, with the boundaries of the 7 meta-clade groups super-imposed as a white line. FDA approved compounds are projected onto SOMDTP as blue hexagons, where hexagons are sized according to the number of FDA agents appearing in any node. Panel B displays the between node GI50codebook Euclidean distances for nodes with FDA compound projections (top) and without (bottom). Panel C lists FDA compound names grouped by 28 meta-clades. Panel D displays SOMDTP with FDA compounds (blue hexagons), meta-clade boundaries (solid lines) and meta-clade labels as numbers. FDA approved projections to SOMDTP nodes are listed in S5 master_appendix sheet appendix_Table_III.

