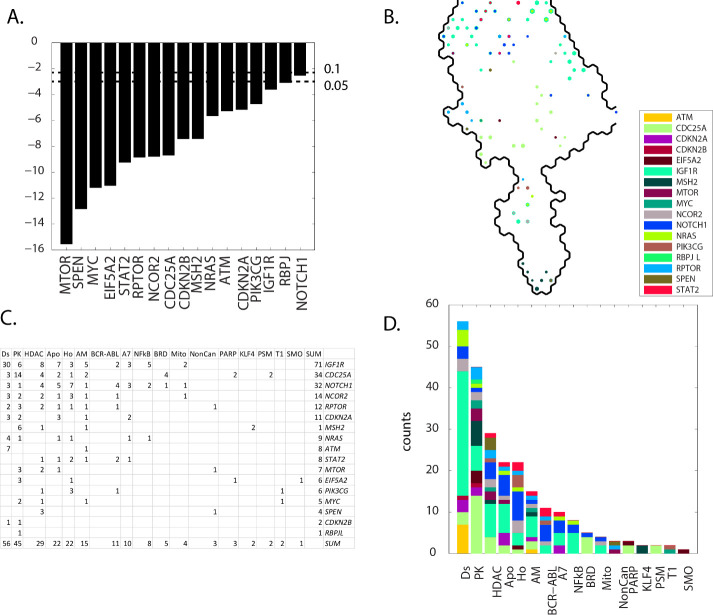
Fig 11. Results for group C(meta-clades 10 through 15).
The SOMDTP region displayed in Panel B represents the boundary for meta-clades 10 through 15 (see the white border in Fig 8 Panel A). S8 master_appendix sheet gp_C lists the table in Panel C. See the legend of Fig 9 for details. S15 master_appendix sheet gp_C_FDA lists the FDA compounds associated with these defective genes.

