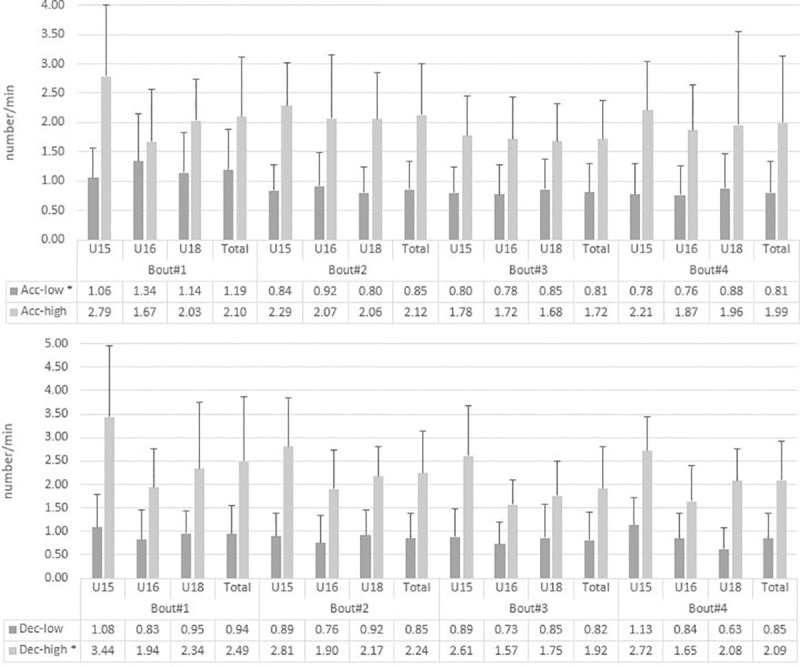
Fig 2. Number of low (< ±3 m∙s-2) and high (≥ 3 ± m∙s-2) acceleration and deceleration over the course of training concerning age groups.

Panel A presents number of acceleration-low & high as mean-values in number/min. Panel B shows the number of deceleration-low & high as mean-values in number/min. * Significant differences (P ≤ 0.05).
