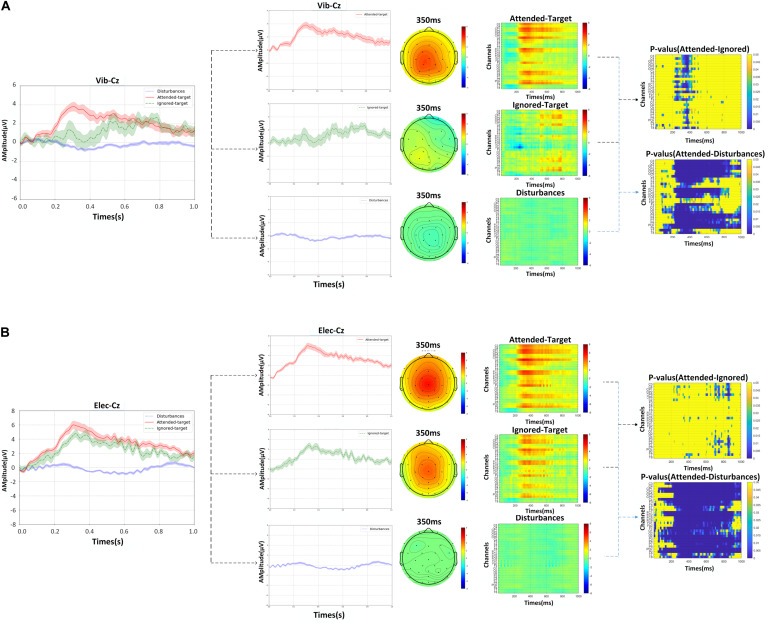
FIGURE 5.
The grand averaged waveforms with error-shaded bar (with the standard error), corresponding scalp topographies at a latency of 350 ms, the grand averaged ERPs responses from EEG channels for attended-targets, ignored-targets and disturbance stimuli at Cz over all subjects, and p-values of the amplitude differences between the ERPs of response to attended-target and ignored target stimuli as determined by the ANOVA: (A) the data of vibration, (B) the data of electricity.

