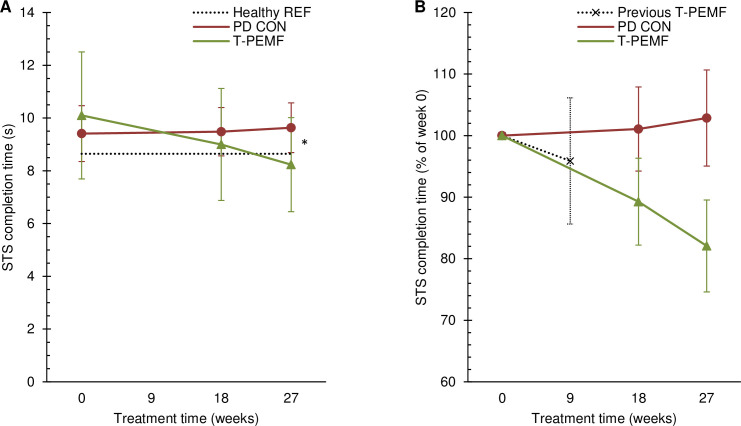
Fig 1. Sit-to-stand completion time.
Absolute (A) and relative (B) completion time over the study period for the group receiving T-PEMF treatment (T-PEMF; green, solid line with triangles) and the PD control group (PD CON; red, solid line with circles). A: * Significantly different performance course over time (P<0.05) between T-PEMF and PD CON. Healthy reference level is indicated (Healthy REF; grey, dotted line). B: The relative change in a T-PEMF group from our previous study by Malling et al. after 8 weeks of treatment is indicated (Previous T-PEMF; black, dotted line with x’s) [15].

