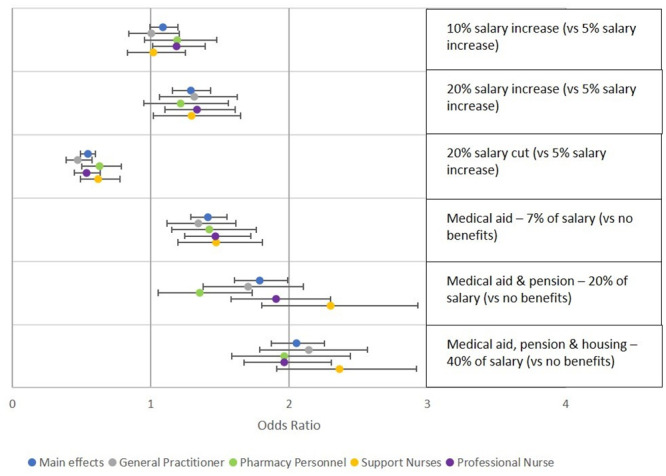
Fig 3. Preferences regarding salary and benefits packages.

This figure shows results of models stratified by cadre, including odds ratios and 95% confidence intervals, for attributes related to salary and benefits.

This figure shows results of models stratified by cadre, including odds ratios and 95% confidence intervals, for attributes related to salary and benefits.