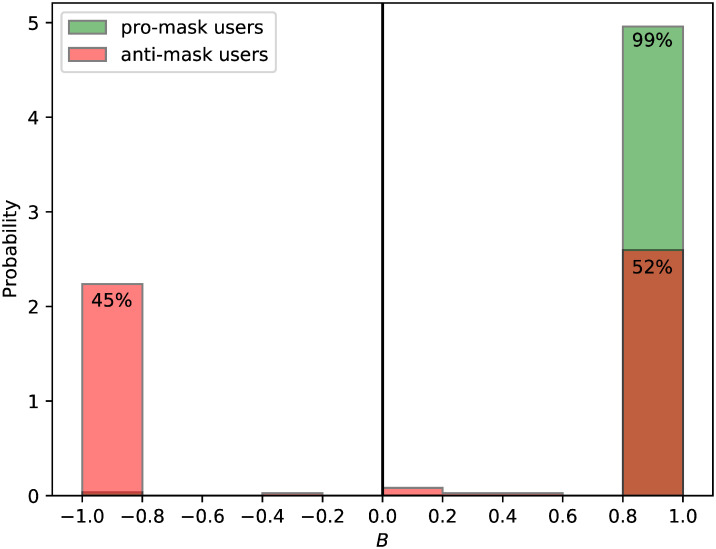
Fig 6. The distribution of the response bias B (Eq 4) for both pro-mask and anti-mask users.
The vast majority of users fall near the extremes of possible values of the response bias (i.e. within 0.2 of B = +1 or B = −1), with the percent of users in a given group indicated for each extreme bin.

