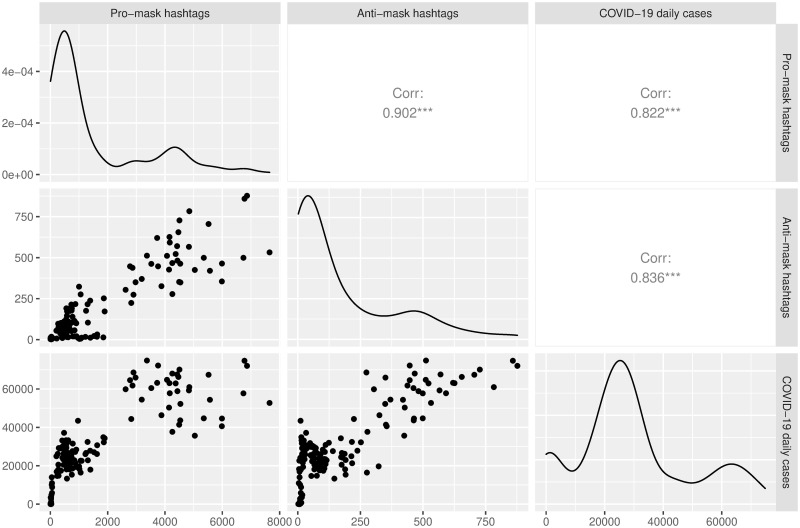
Fig 7. Correlation matrix of the time series of pro-mask hashtags, anti-mask hashtags, and daily confirmed COVID-19 cases.
On the diagonal are shown the density plots, which visualize the distributions of the three variables over continuous intervals, with hashtag/case counts on the horizontal axis and number of days (normalized) using kernel probability estimation on the vertical axis.

