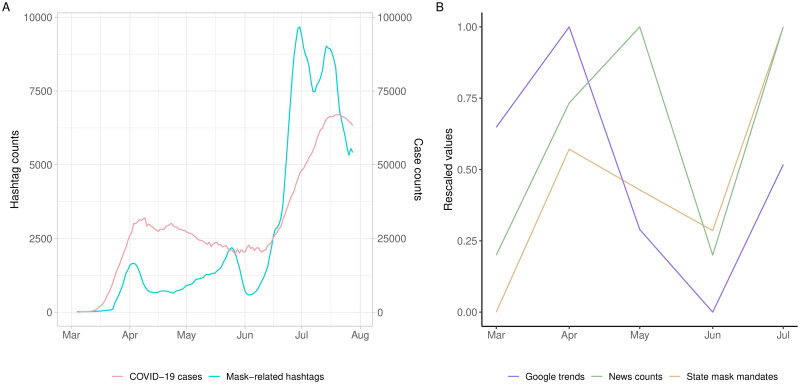
Fig 8.
(A) Mask-related hashtag counts and daily confirmed COVID-19 case counts in the U.S. from early March to the end of July 2020. The figure plots the trends of mask-related hashtags on the left y-axis and the trajectory of daily confirmed COVID-19 cases on the right y-axis using seven-day moving averages for the two data series. (B) Three temporal trends from early March to the end of July 2020: (1) monthly statewide mask mandates, (2) monthly Google Trends searches for “face mask,” and (3) monthly high-profile mask-related news headlines. The volume of each temporal trend is rescaled from 0 to 1 for the ease of comparison.

