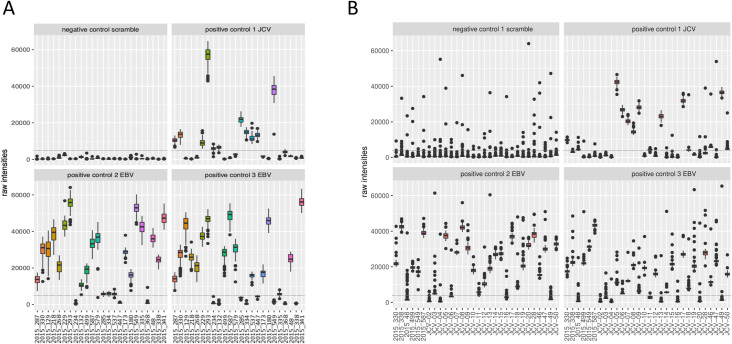
Fig 2. Box plots of raw intensities measured against control peptides in both microarray experiments.
This figure represents the raw output values of IgG reactivity (y-axis) of the different samples (x-axis) to the different control peptides during array experiment 1 (A) and array experiment 2 (B). Both arrays included a scramble peptide (negative control), one John Cunningham virus (JCV) peptide and two Epstein-Barr viral peptides (EBV1 and EBV2) in 135-flold. Dotted line indicates the cut-off for positivity (5,000 relative light units (RLU)).

