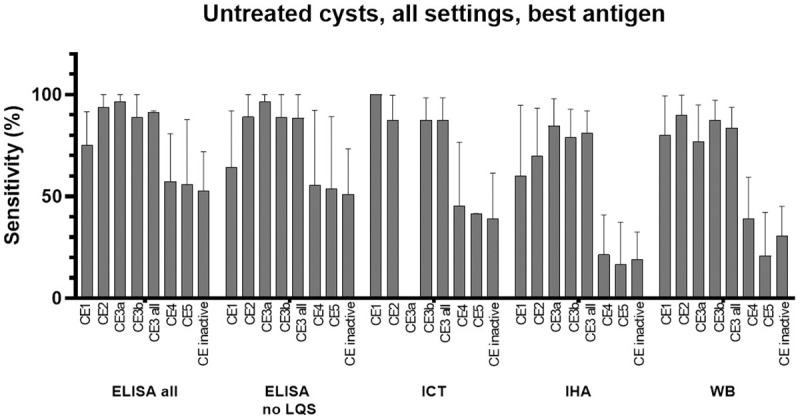
Fig 2. Sensitivity (%) of different serology tests for the diagnosis of untreated hepatic CE cysts according to cyst stage.

“CE3 all” = data from CE3a + CE3b + CE3 not divided into CE3a and CE3b. “CE inactive” = data from CE4 + CE5 + CE4 and CE5 not divided into CE4 and CE5. LQS = Low Quality Studies. Data from papers referring to the field or to the hospital/lab setting were included. In case more than one assay per type was investigated in the same paper (e.g. more than one ELISA test), the one with the best sensitivity was used for the meta-analysis. Error bars represent 95% CI.
