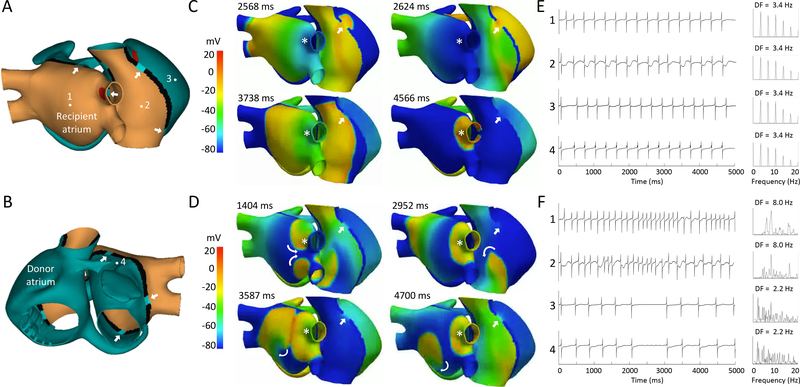
Figure 2.
3D computational modeling in bi-atrial anastomosis (panels A and B). White arrows indicate the locations of the atrio-atrial connection (AAC) scenarios simulated. The numbers indicate the location of the calculated electrograms. C. Voltage snapshots of a recipient focal right superior pulmonary vein tachycardia (CL= 300 ms, white asterisk) with a superior right atrial AAC (4 mm thickness, white arrow). E. Electrograms recorded from locations 1–4 and their respective power spectra. D. Atrial fibrillation (CL= 125ms) maintained by recipient bi-atrial reentry (curved arrows). F. Electrograms recorded from locations 1–4 and their respective power spectra.

