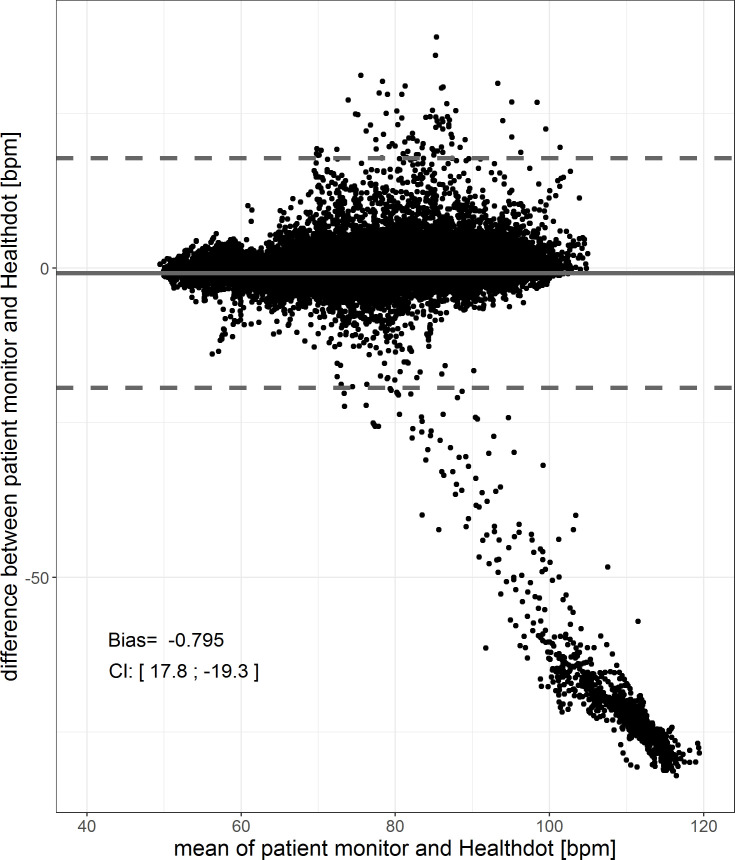
Fig 4. Bland-Altman plot of the HeartR.
The difference between the two methods (Healthdot and patient monitor) is plotted against the average of the two, respectively on the y-axis and x-axis. The bias (-0.80 bpm) is indicated by the gray solid line and the confidence interval [CI: 17.8; -19.3 bpm] is indicated by the gray dashed lines.

