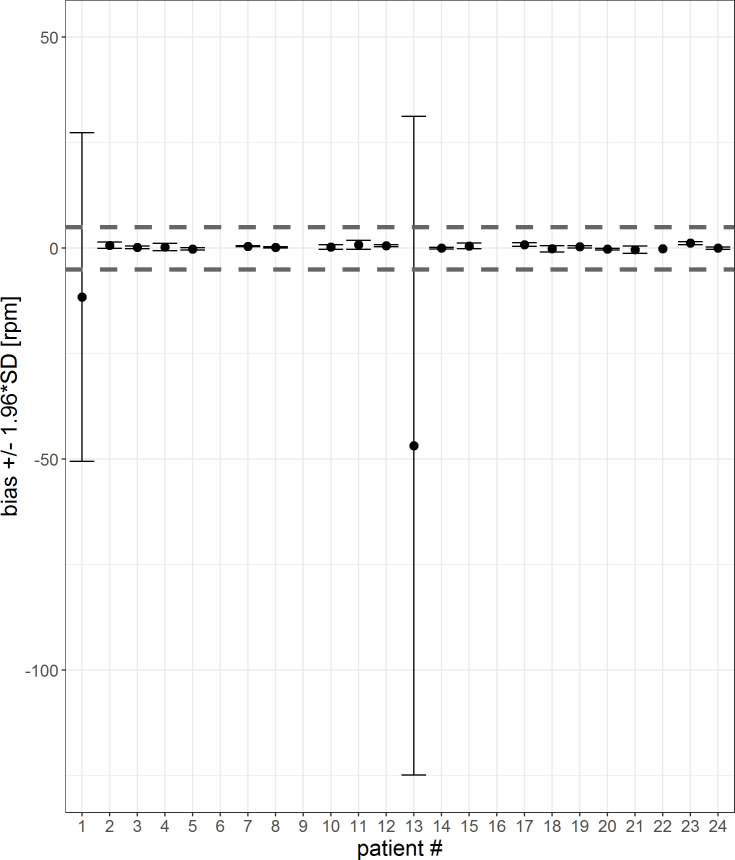
Fig 7. Error bar of each patient for a 5-min-interval.
The mean differences and confidence interval (bias +/- 1.96*SD) for each patient are plotted. Difference was calculated by subtracting patient monitor data from Healthdot data, based on 5-min averages. The gray dashed lines indicate the required threshold of 5 bpm.

