
Figure 3.
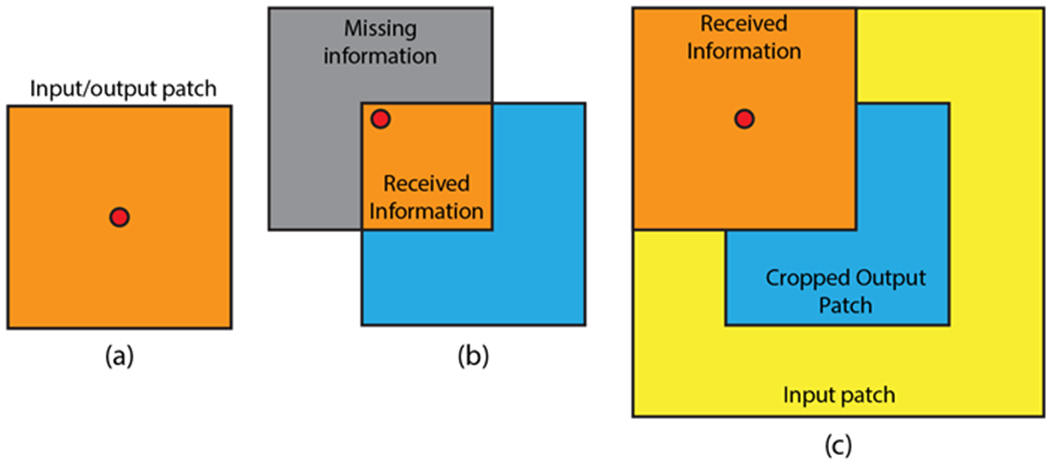
Demonstration of the relationship between receptive field and input/output patch size. a) Input patch size = output patch size, red dot represents voxels near the patch center. b) Input patch size = output patch size, voxels near the patch edge receive only information from the orange region. c) Input patch size > output patch size (with center cropping), voxels near the edge receive more information than in b).