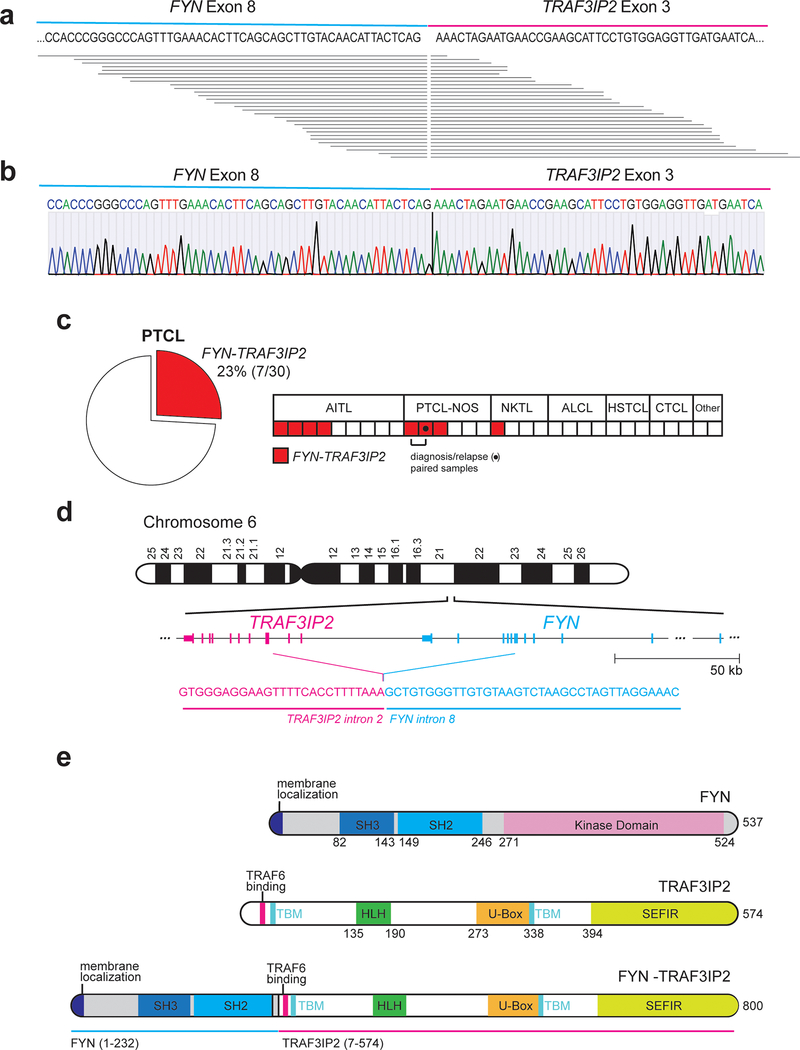
Figure 1. Identification of the FYN-TRAF3IP2 gene fusion in PTCL.
a, Schematic representation of the FYN-TRAF3IP2 fusion transcripts identified in RNAseq. Each horizontal line represents a chimeric FYN-TRAF3IP2 RNAseq read. b, Representative dideoxynucleotide sequencing result of the FYN-TRAF3IP2 cDNA from a PTCL index sample. c, Frequency and distribution across PTCL groups of samples harboring the FYN-TRAF3IP2 fusion transcript identified by RT-PCR (total patients n=30; total samples n=31, AITL, n=9; PTCL, NOS, n=6 (includes a paired diagnostic-relapse pair from same patient); extranodal NKTCL, nasal type, n=4; anaplastic T cell lymphoma, ALCL, n=4; hepatosplenic T cell lymphoma, HSTCL, n=3; cutaneous T cell lymphoma, CTCL, n=3; adult T cell leukemia/lymphoma, ATL, n=1; subcutaneous panniculitis-like T-cell lymphoma, SPTCL, n=1). d, Schematic representation of the chromosomal rearrangement event resulting in expression of the FYN-TRAF3IP2 fusion RNA and breakpoint sequence identified by whole genome sequencing of an index (RNAseq and RT-PCR positive) sample. e, Schematic representation of the structures of the FYN kinase, TRAF3IP2 protein, and FYN-TRAF3IP2 fusion protein. SH3, Src homology 3 domain; SH2, Src homology 2 domain; TBM, TRAF-binding motif; HLH, Helix-loop-helix domain; SEFIR, SEF/IL-17R signaling domain.

