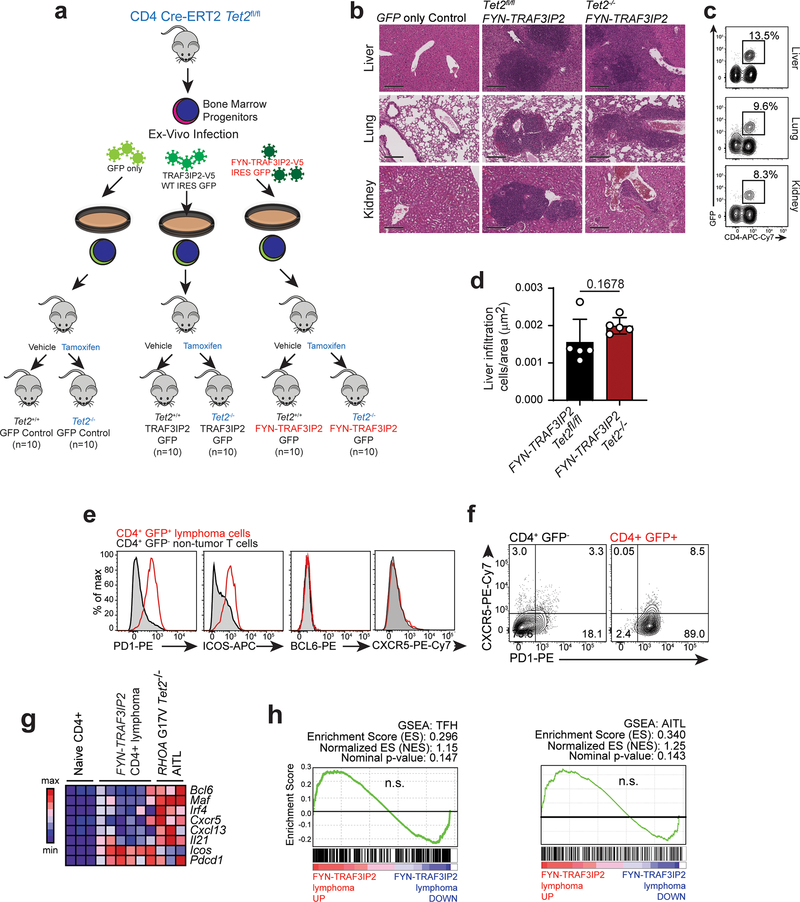
Extended Data Fig. 4: Generation and characterization of FYN-TRAF3IP2-induced mouse PTCL.
a. We transduced hematopoietic progenitors from CD4 Cre-ERT2 Tet2fl/fl mice with bicistronic retroviruses driving the expression of GFP, FYN-TRAF3IP2-V5 and GFP or wild type TRAF3IP2-V5 and GFP. We intravenously transplanted the infected cells into lethally irradiated C57BL/6 recipient mice and treated them 8 weeks post-transplant with vehicle only or with tamoxifen to preserve or delete Tet2 in CD4+ T cells, respectively. These cohorts of mice were then immunized with sheep red blood cells every 4–5 weeks to induce peripheral T cell activation. b, Representative histological micrographs of hematoxylin-eosin stained liver, lung, and kidney of Tet2fl/fl or Tet2−/− FYN-TRAF3IP2-induced lymphoma-bearing animals and the GFP only control. Tissues from 3 mice per group showed similar results. Scale bar = 200 μm. c, Representative FACS plots of mononuclear cells collected from liver, lung, and kidney of FYN-TRAF3IP2-induced lymphoma-bearing animals, showing GFP+ CD4+ cell infiltration. d, Quantitative analysis of lymphoma liver infiltration in FYN-TRAF3IP2 Tet2fl/fl and FYN-TRAF3IP2 Tet2−/− tumors. Results are reported as mean of values (bar) ± standard deviation (error bar) with individual values (white circles), n=5 (5 tumors from 5 different mice per condition). The P value was calculated using two-tailed Student’s t-test. e, Representative flow cytometry analyses of PD1, ICOS, BCL6 and CXCR5 Tfh cell marker expression in CD4+ GFP+ spleen tumor cells compared to CD4+ GFP− non-tumor cells from the same spleen. f, Flow cytometry analysis of PD1 and CXCR5 Tfh cell marker expression in CD4+ GFP− non-tumor cells and CD4+ GFP+ tumor cells from a representative FYN-TRAF3IP2-induced lymphoma-bearing spleen. g, Heatmap representation of Tfh-associated marker expression in CD4+ naïve wild type T cells, FYN-TRAF3IP2-induced CD4+ GFP+ lymphoma cells and RHOA G17V Tet2−/− AITL-like mouse tumor cells53. h, GSEA enrichment plots of differentially expressed genes associated with FYN-TRAF3IP2-induced mouse lymphoma cells compared to wild type naïve CD4+ T cells. AITL geneset: top differentially upregulated genes in AITL compared with PTCL, NOS (fold change 1.5, p <0.002)38. Tfh geneset: top 100 genes associated with Tfh cells37.

