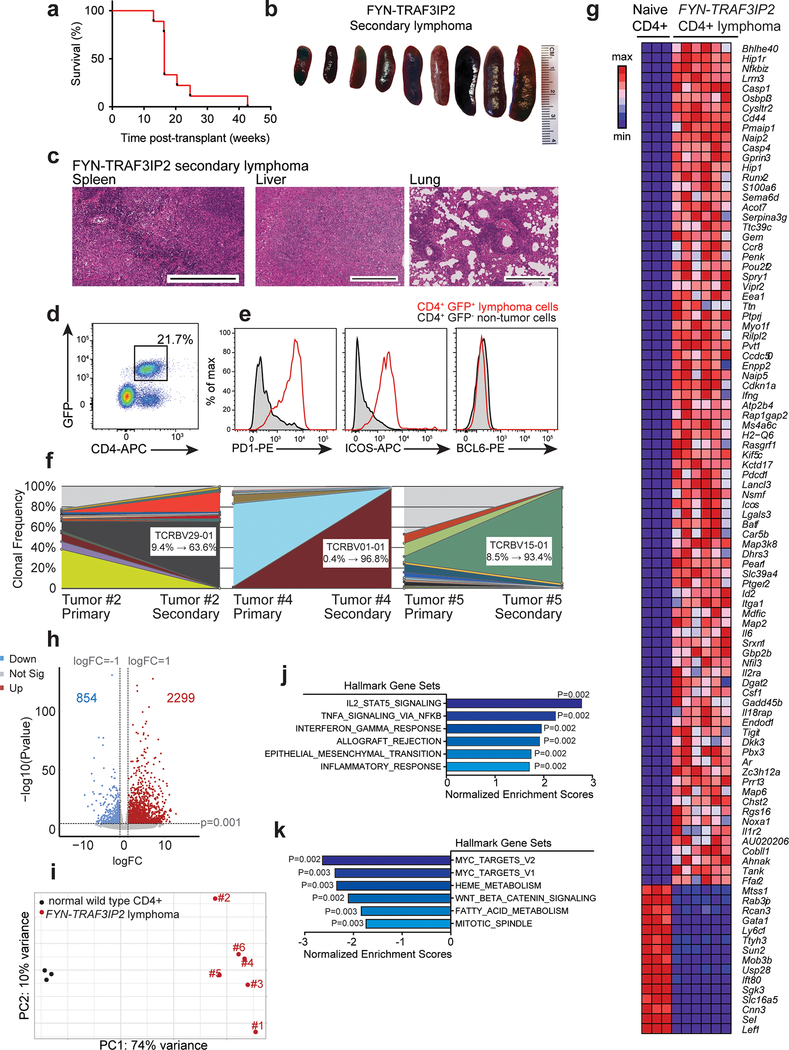
Extended Data Fig. 6: Characterization of FYN-TRAF3IP2-induced mouse PTCL: transplantability and transcriptional profiling.
a, Kaplan-Meier survival curve of 9 mice transplanted with cell suspension containing FYN-TRAF3IP2 GFP+ lymphoma infiltrate. b, Spleens of secondary recipients transplanted with FYN-TRAF3IP2-induced lymphoma infiltrate. c, Representative histological micrographs of H&E stained spleen, liver, and lung of lymphoma transplanted mice at the endpoint showing lymphoma infiltration. Tissues from 3 mice showed similar results. Scale bar = 400 μm. d, Representative FACS plot showing GFP+ CD4+ lymphoma infiltrates in spleens from diseased secondary recipients. e, Representative flow cytometry analyses of PD1, ICOS and BCL6 Tfh cell marker expression in CD4+ GFP+ spleen tumor cells compared to CD4+ GFP− non-tumor cells from the same spleen. f, Tcrb gene clonal analysis of three secondary Tet2−/− FYN-TRAF3IP2 GFP+ lymphomas illustrated by side-by-side representation of Tcrb sequence reads from primary and secondary Tet2−/− FYN-TRAF3IP2 GFP+ lymphomas, indicating the retention and expansion of specific lymphoma clone with unique Tcrb rearrangements after transplantation. g, RNAseq data of six independent FYN-TRAF3IP2-induced mouse CD4+ GFP+ lymphomas and wild type isogenic mouse naïve CD4+ T cells represented as heat map of the unselected top 100 differentially expressed genes between FYN-TRAF3IP2-induced tumors and wild type CD4+ naïve T cells (mouse genes without known human orthologues excluded; scale bar shows color-coded differential expression, with red indicating higher levels of expression and blue indicating lower levels of expression). h, Volcano plot of all differentially expressed genes as in g (P value <0.001 and |log2(fold change)|> 1 deemed significant). Blue, significantly downregulated genes. Red, significantly upregulated genes. The number of significantly downregulated or upregulated genes is indicated. i, Principal component analysis plot of RNAseq data as in g. j-k, GSEA analyses of differentially expressed genes associated with FYN-TRAF3IP2-induced mouse lymphomas based on the RNAseq data and the Hallmark signatures69 from MSigDB. The top 6 upregulated signatures j and top 6 downregulated signatures k are represented as bar graphs of normalized enrichment scores and P values.

