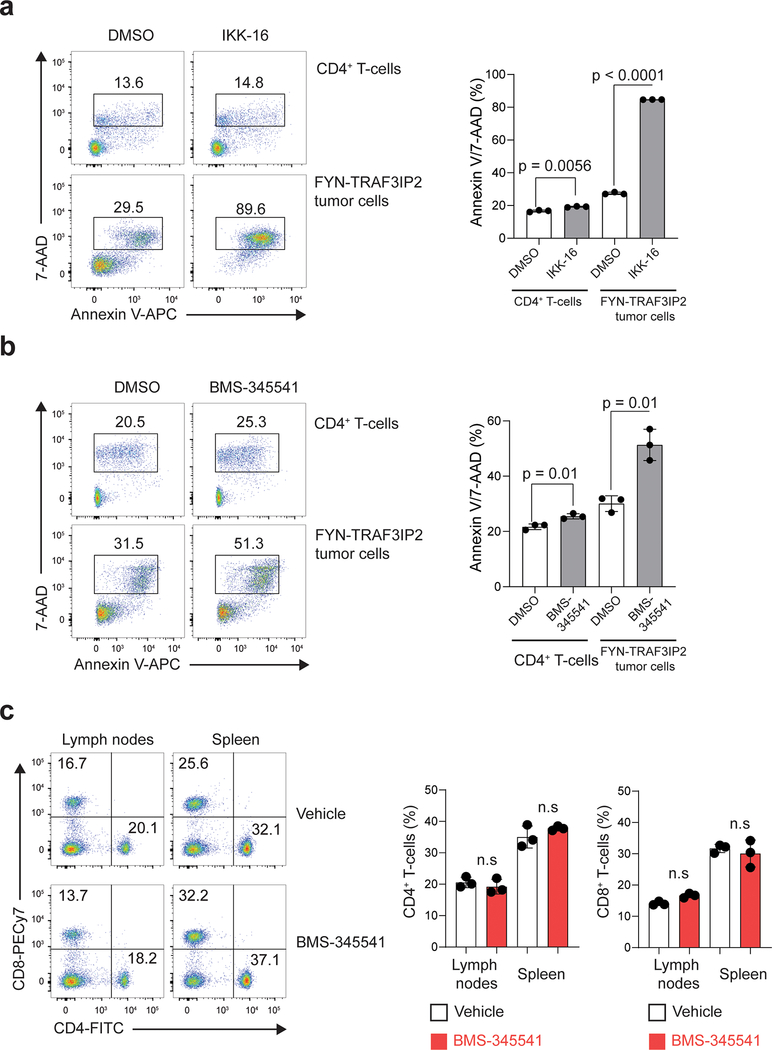
Extended Data Fig. 7: IKK inhibitor treatment in normal T-cells.
a, Representative flow cytometry plot and quantification of the analysis of apoptosis in normal CD4+ T cells and CD4 FYN-TRAF3IP2 lymphoma cells treated with vehicle only (DMSO) or the IKK16 inhibitor. b, Representative flow cytometry plot and quantification of analysis of apoptosis in normal CD4+ T cells and CD4 FYN-TRAF3IP2 lymphoma cells treated with vehicle only (DMSO) or the BMS345541 IKK inhibitor. c, Representative flow cytometry plot and quantification of normal lymphocytes in spleen and lymph nodes of mice treated with vehicle only or with the BMS-345541 IKK inhibitor in vivo. Results are reported as mean of replicate values from 3 mice (bar) ± standard deviation (error bar) with individual values (black circles), n=3. P values were calculated using two-tailed Student’s t-test.

