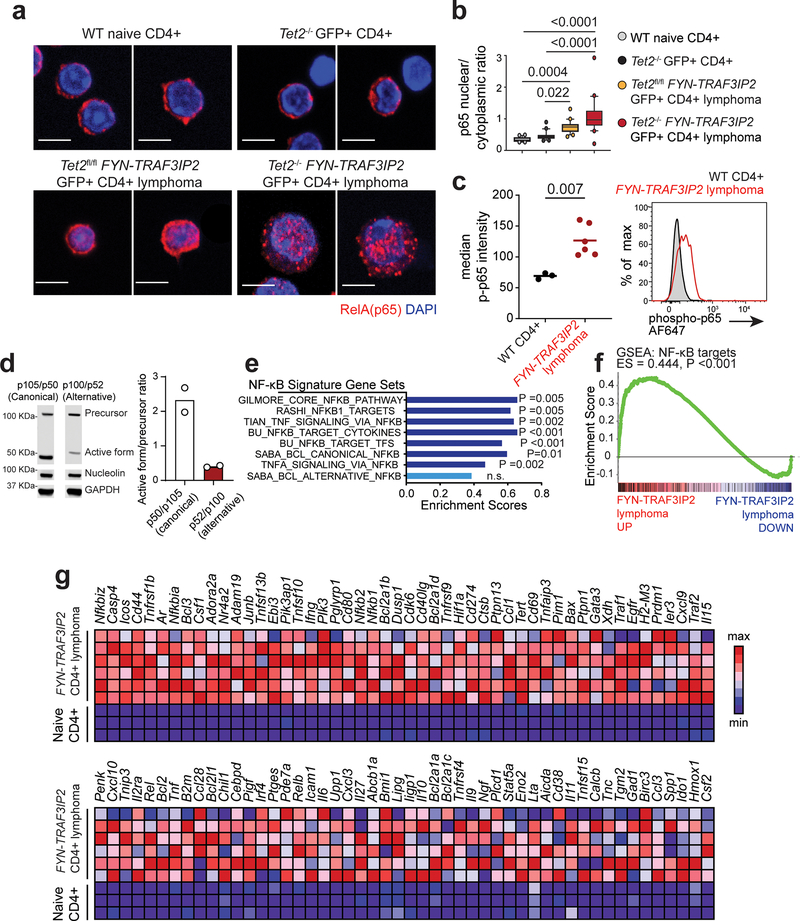
Figure 7. NF-κB activation in FYN-TRAF3IP2-induced mouse PTCL, NOS.
a, Immunofluorescence analysis of p65 NF-κB intracellular localization in naïve CD4+ T cells, in normal GFP+ CD4+ cells from mice transplanted with Tet2−/− progenitors infected with GFP expressing retroviruses, in GFP+ Tet2f/f FYN-TRAF3IP2 CD4+ lymphoma cells and in GFP+ Tet2−/− FYN-TRAF3IP2 CD4+ lymphoma. p65 proteins shown in red and DAPI-stained nuclei in blue. 2 representative images per condition are shown. Scale bar = 5 μm. b, Quantitation (20 cells from 1 mouse per group) of p65 NF-κB intracellular nuclear/cytoplasmic localization in CD4+ cells as in a. N/C ratio, nuclear/cytoplasmic ratio. The boxplot lines represent median, boxes represent 25–75% intervals, whiskers represent 10–90% intervals and circles represent data points outside the 10–90% interval. P values were calculated using one-way ANOVA and Tukey’s multiple comparison test. c, Flow cytometry analysis of phospho-p65 NF-κB transcription factor levels in FYN-TRAF3IP2-induced CD4+ GFP+ lymphoma cells compared to wild type CD4+ T cell controls. Horizontal lines in the graph indicate the mean, and circles represent values for six independent tumors (red; two Tet2fl/fl FYN-TRAF3IP2 and four Tet2−/− FYN-TRAF3IP2 lymphomas) and three normal CD4+ T cell control samples (black). The P value was calculated using two-tailed Student’s t-test. AF647, Alexa Fluor 647. d, Western blot analysis and quantitation of canonical p105 and alternative p100 NF-κB factor precursor cleavage into active p52 and p50 forms in Tet2−/− FYN-TRAF3IP2 lymphoma cells. Results are reported as mean of n=2 independent experiments with individual values shown as white circles. Expression levels were verified for each independent experiment. e, Bar graph representation of enrichment scores for NF-κB gene signatures obtained by Gene Set Enrichment Analysis (GSEA) of differentially expressed genes associated with FYN-TRAF3IP2-induced mouse CD4+ PTCL, NOS. BCL, B-cell lymphoma. f, GSEA plot corresponding to analysis of the NF-κB target geneset of the BU Gilmore lab database as in e. g, Heat map representation of the GSEA leading edge genes from the analysis of the NF-κB target geneset of the BU Gilmore lab database as in e, f. Scale bar shows color-coded differential expression, with red indicating higher levels of expression and blue indicating lower levels of expression.

