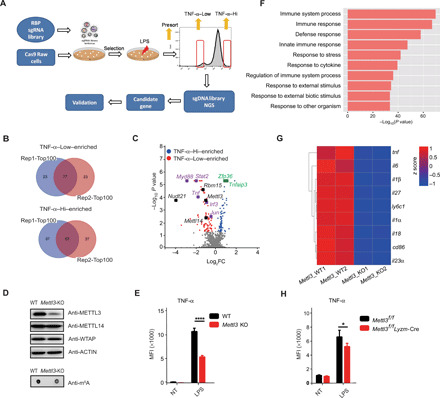
Fig. 1. CRISPR screening identifies METTL3 as a regulator of TNF-α production in macrophages.

(A) Scheme of pooled CRISPR-Cas9 screening of RBPs playing critical roles in macrophage activation. Briefly, Cas9-expressing Raw 264.7 cells were infected with lentivirus library containing sgRNAs targeting RBP genes in the mouse genome. After selection with puromycin for 7 days, the cells were stimulated with LPS and sorted by flow cytometry on the basis of the expression levels of TNF-α. (B) Venn diagrams showing the overlap between the top 100 ranked candidate genes enriched in TNF-α–Low and TNF-α–Hi populations in two replicate screens. (C) Volcano plot showing sgRNA-targeted genes enriched in the TNF-α–Hi (blue) and TNF-α–Low (red) populations. Known positive regulators (purple), negative regulators (green), and m6A modulators (black) of TNF-α production in macrophages are highlighted. (D) Protein level of METTL3 and the overall RNA m6A methylation levels in WT and Mettl3-KO Raw 264.7 cells were measured by Western blotting and m6A dot blot assay. (E) Expression of TNF-α in METTL3-depleted and control Raw 264.7 cells after LPS stimulation measured by flow cytometry. MFI, median fluorescence intensity; NT, not treated. (F) GO enrichment analysis of down-regulated transcripts in Mettl3-KO Raw 264.7 cells compared to WT control cells. (G) Heatmap illustrating the expression of transcripts downstream of the TLR4 signaling pathway in Mettl3-deficient and WT Raw 264.7 cells. (H) Expression of TNF-α in bone marrow–derived macrophages (BMDMs) from Mettl3flox/flox;Lyzm-Cre and Mettl3flox/flox control mice upon LPS stimulation measured by flow cytometry. Data are shown from two experiments (B and C), as a representative result of three independent experiments (D), or as means ± SEM (E and H).*P < 0.05 and ****P < 0.0001 (unpaired two-tailed Student’s t test).
