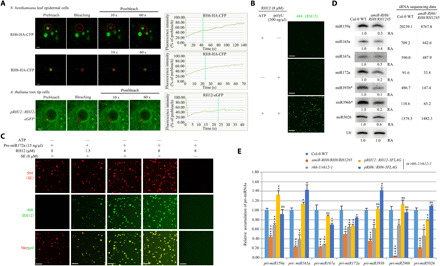
Fig. 3. RH6/RH8/RH12 drives D-body formation through LLPS.

(A) Representative images and fluorescence recovery curves of the RNA helicase FRAP in N. benthamiana leaf epidemical cells or root tip meristematic cells of 1-week-old A. thaliana. Scale bars, 2 μm. The fluorescence intensity was normalized against the average prebleach fluorescence. n = 3 for each protein. The green dashed line indicates the half-recovery time. (B) In vitro phase separation of RH12 proteins with or without polyU (300 ng/μl) and/or 5 mM ATP. Scale bars, 20 μm. (C) In vitro phase separation of SE with/without RH12 under pre-miR172a (15 ng/μl). Scale bars, 20 μm. (D) Northern blot (left panels) and small RNA (sRNA) sequencing (right) analysis of miRNAs. U6 was used as a loading control. The relative abundance (RA) of miRNAs in amiR-RH6/RH8/RH12 transgenic plants compared to Col-0 WT plants is indicated. The sequencing data are shown as reads per million mapped reads. (E) Quantitative reverse transcription polymerase chain reaction (qRT-PCR) analysis of selected pri-miRNAs in 3-week-old plants. Elongation factor 1-α (EF-1α) was used as an internal control. Each error bar represents 1 SD of three biological replicates. Student’s t test, *P < 0.05, **P < 0.01, ***P < 0.001, and ****P < 0.0001; for the others, P ≥ 0.05. eGFP, enhanced GFP; ns, not significant.
