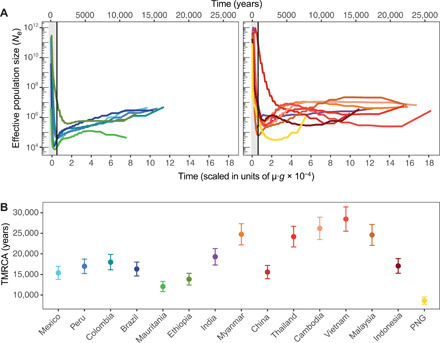
Fig. 6. Coalescent-based inference of the demographic history in each P. vivax population.

(A) Effective population size (Ne) variations back to the TMRCA inferred using MSMC and (B) inferred TMRCA in each population. The analysis was performed using five individuals from each population, assuming a mutation rate per generation (μ·g) of 1.158 × 10⁻⁹ and a generation time (g) of 0.18. The gray area represents the first 1000 generations, at which low resolution of the recent past effective population size is observed, likely due to the presence of sites with high probability of being called inaccurately.
