Figure 2.

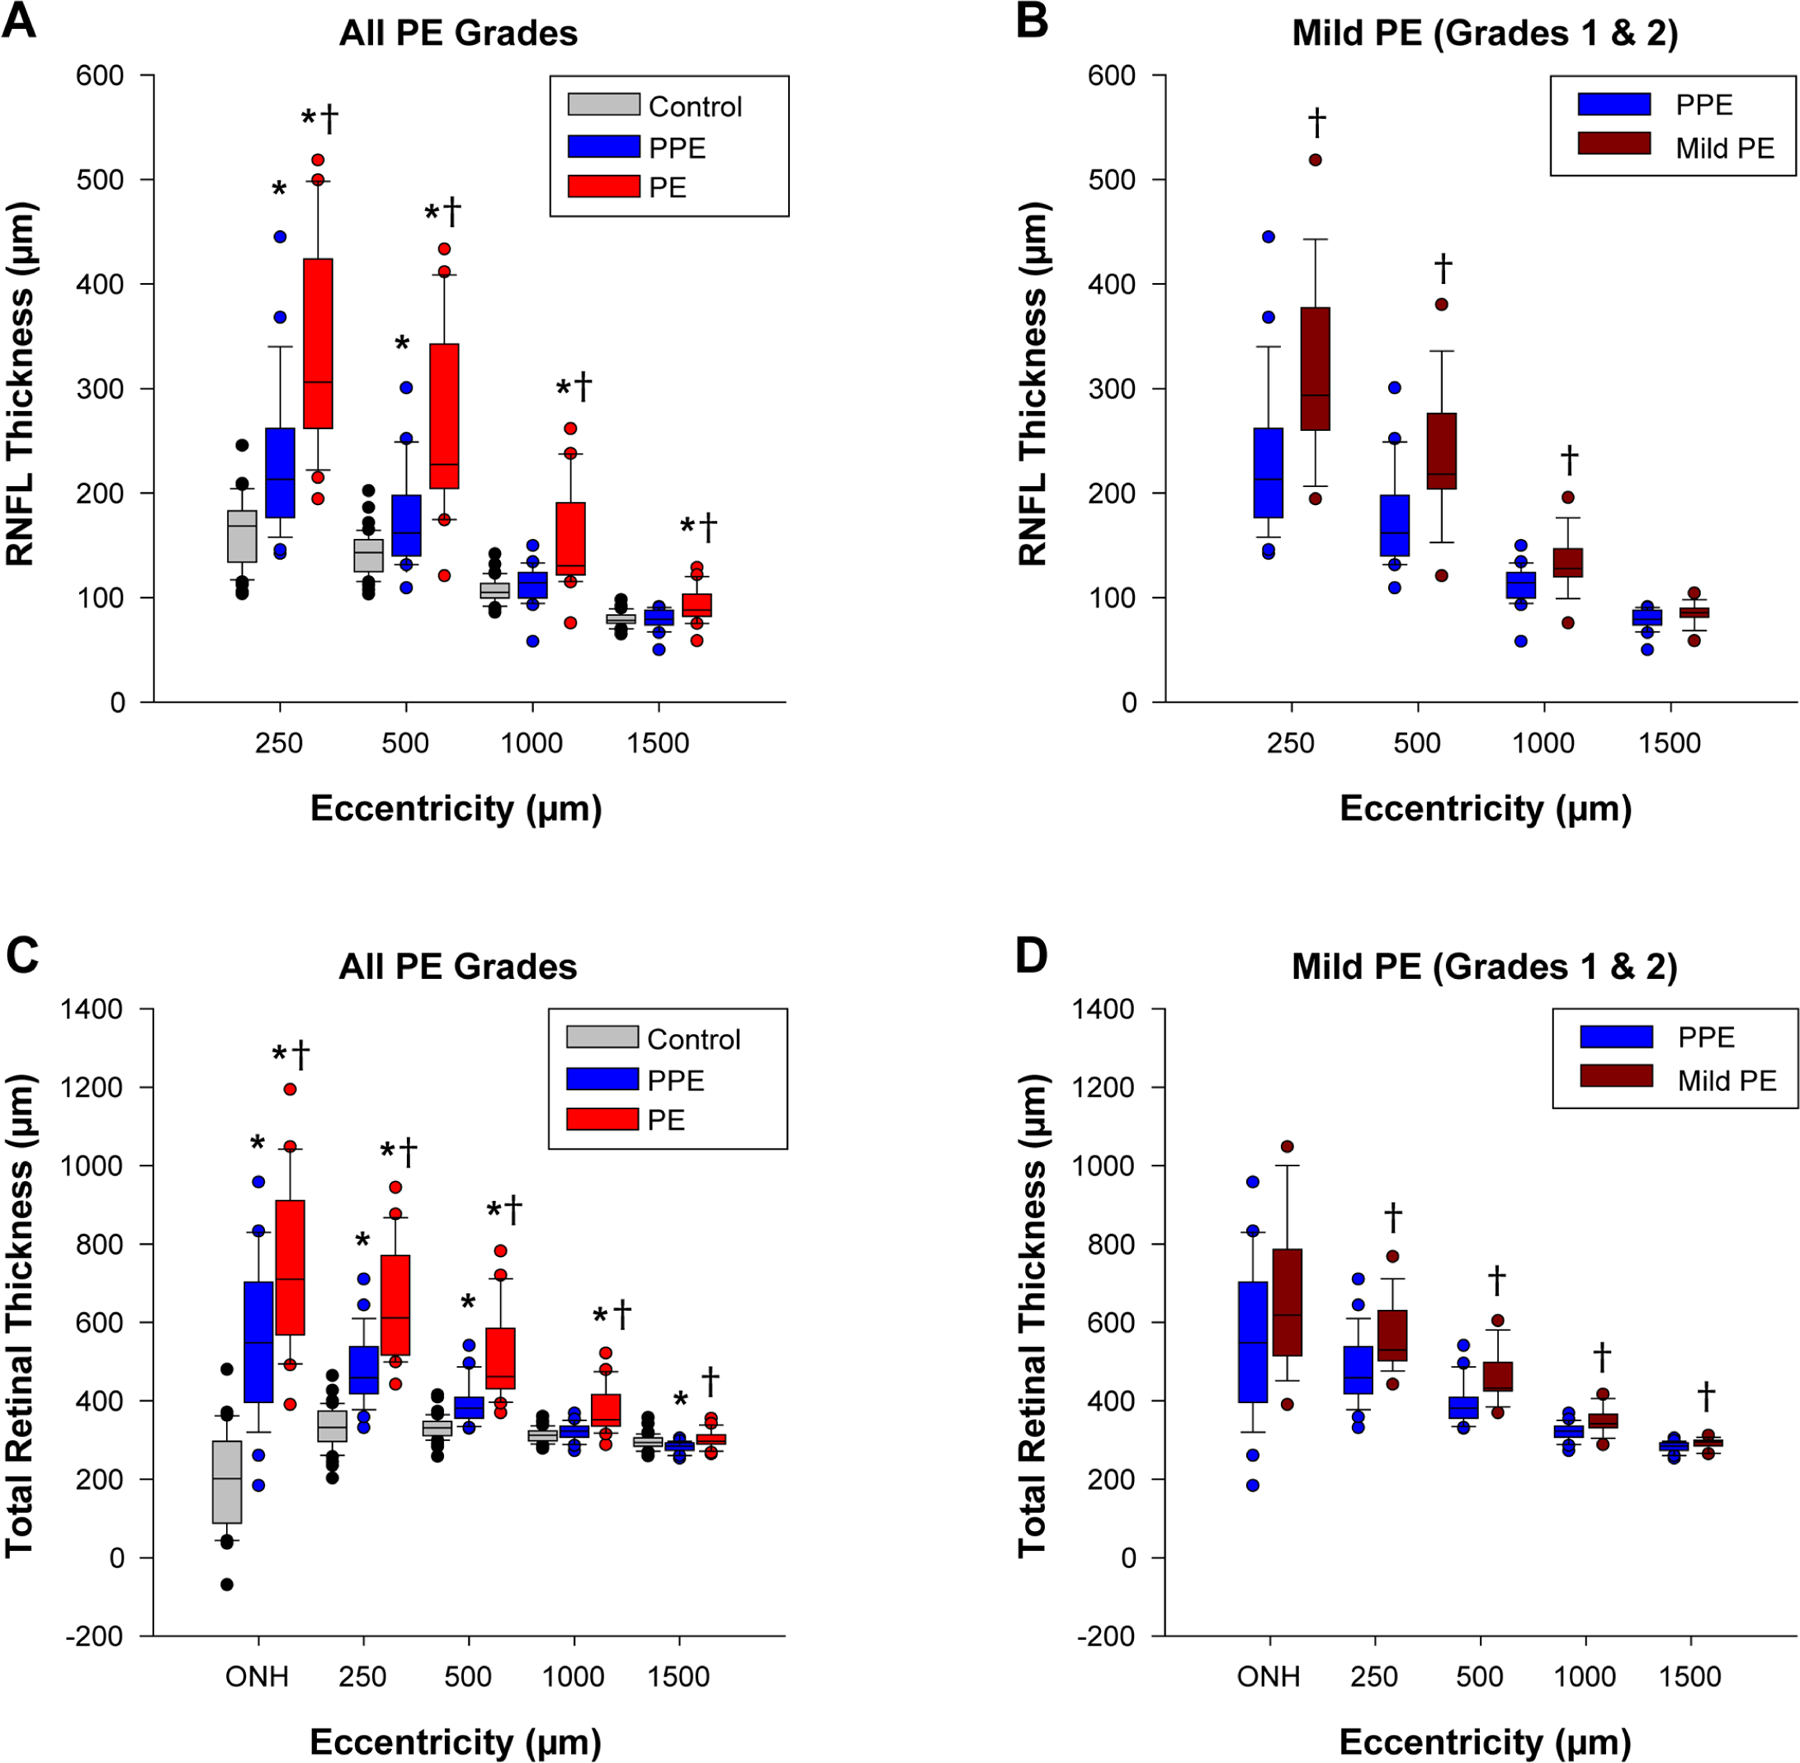
Retinal nerve fiber layer thickness (RNFLT) and total retinal thickness (TRT) at various eccentricities. Boxes represent the 25th and 75th percentiles, whiskers represent the 10th and 90th percentiles, and the horizontal line depicts the median thickness. (A&B) RNFLT comparisons between groups for all grades of papilledema and mild papilledema. (C&D) TRT comparisons for all grades of papilledema and mild papilledema. *Comparison with control is statistically significant (P < 0.0125); †comparison with pseudopapilledema is statistically significant (P < 0.0125).
