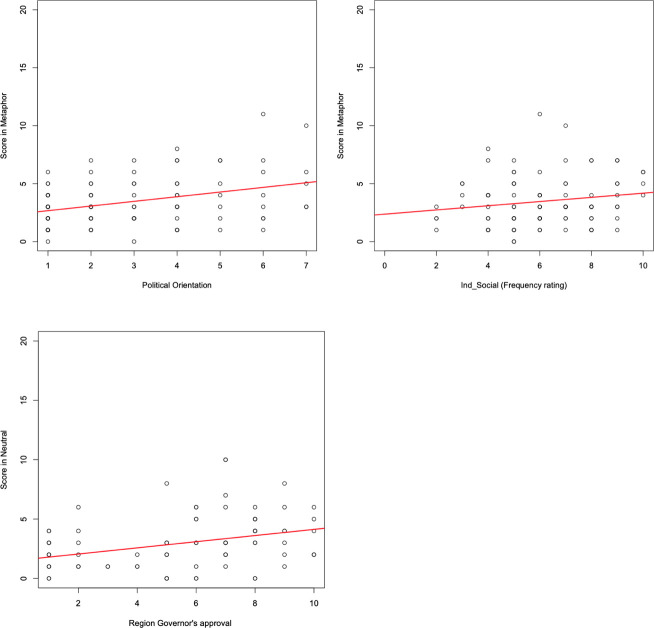
Fig 2. Predictors of participants’ score in the metaphor task.
Top: Correlations between participants’ score in the metaphor condition and their political orientation (left panel) and the frequency rating (composite score) for independent information channels and social networks (right panel). Bottom: Correlation between participants’ score in the neutral condition and their Region governor’s approval.

