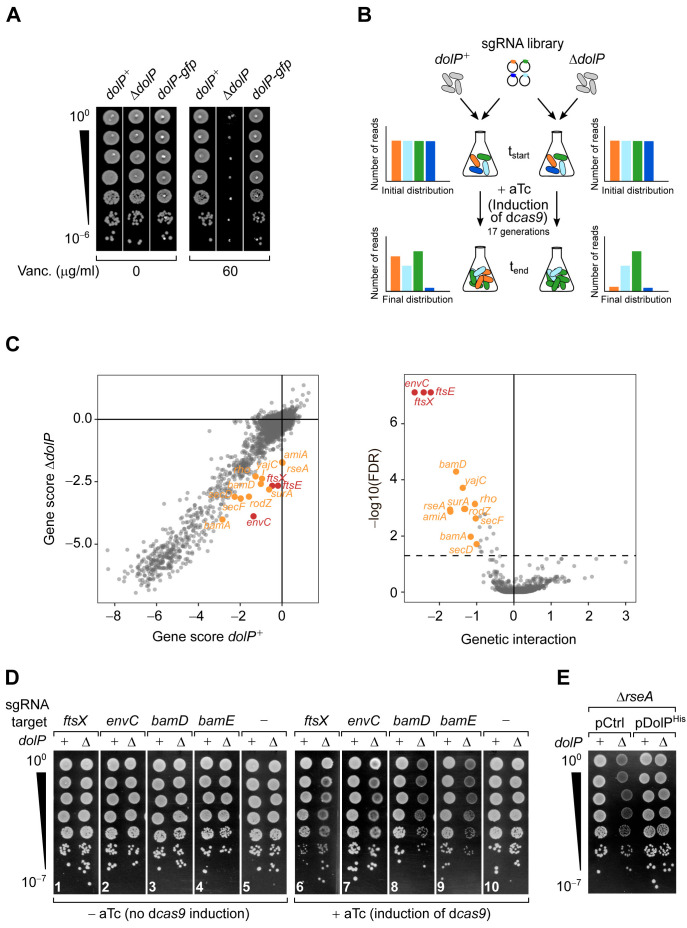
Figure 1. Genome-wide screen of dolP genetic interactions.
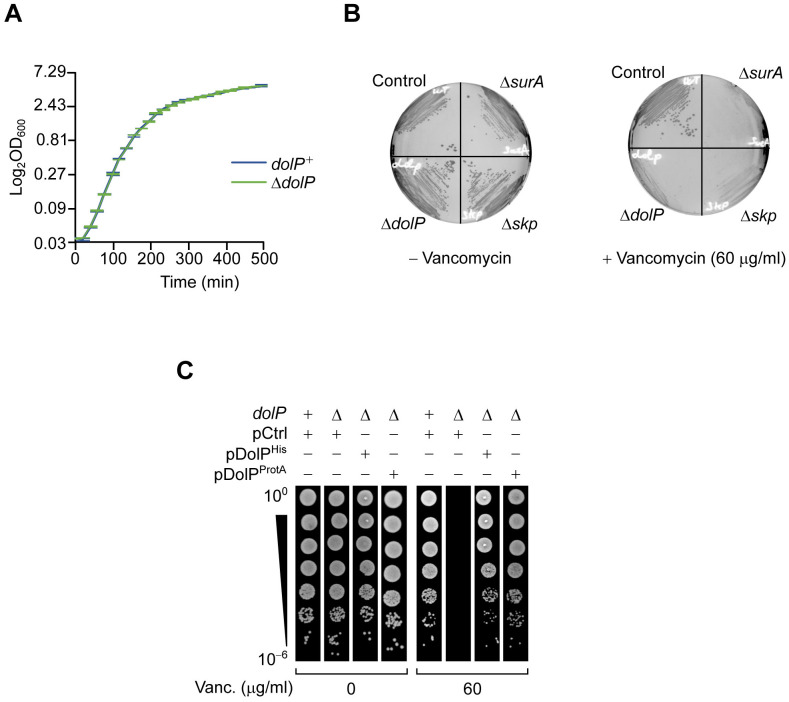
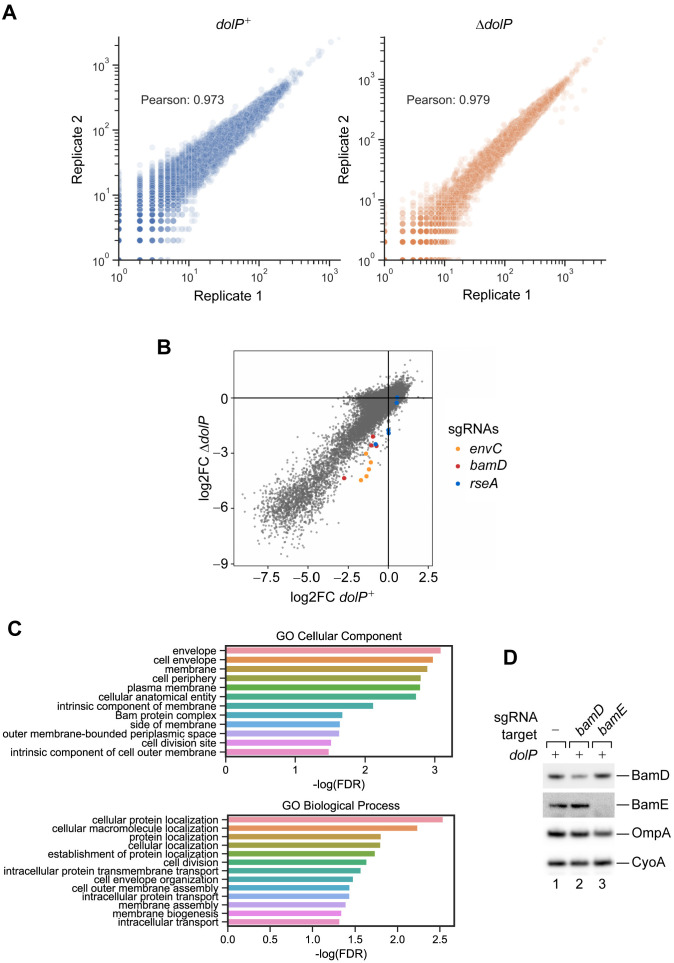
(A) The deletion of dolP impairs OM integrity. The indicated strains were serially diluted and spotted onto LB agar plates lacking or supplemented with 60 μg/ml vancomycin as indicated. (B) Schematic representation of the CRISPR-based gene silencing approach. LC-E75 (dolP+) or its ΔdolP derivative strain, both carrying dcas9 under the control of an anhydrotetracycline (aTc)-inducible promoter in their chromosome were transformed with a library of plasmids encoding gene-specific sgRNAs. The library covers any E. coli MG1655 genetic features with an average of five sgRNAs per gene. Pooled transformed cells were cultured to early exponential phase prior to plasmid extraction and quantitative Illumina sequencing to assess the initial distribution of sgRNA constructs in each culture (tstart). Upon addition of 1 μM aTc to induce sgRNA-mediated targeting of dcas9 for approximately 17 generations, samples of cells from each culture were newly subjected to plasmid extraction and Illumina sequencing to determine the final distribution of sgRNA constructs (tend). (C) Left: Comparison of gene scores obtained in dolP+ and ΔdolP screens. The log2 fold-change (log2FC) between tend and tstart calculated for each sgRNAs (Figure 1—figure supplement 2B) was grouped by gene target, and their median was used to derive fitness gene scores (see also Figure 1—source data 1 and 2). Right: Volcano plot of the dolP genetic interaction scores. The x-axis shows a genetic interaction score calculated for each gene based on the minimum hypergeometric (mHG) test conducted on the ranked difference of sgRNA-specific log2FC values between the ΔdolP and the dolP+ screens. The y-axis shows the log10 of the false discovery rate (FDR) of the test. The dashed line shows FDR = 0.05. In both panels, genes highlighted in orange have FDR < 0.05 and GI >1 whereas genes highlighted in red have FDR < 0.05 and GI > 2. (D and E) Validation of the genetic interactions determined in (C). (D) LC-E75 (dolP+) or its ΔdolP derivative strain expressing sgRNAs that target the indicated genes were serially diluted and spotted on LB agar lacking or supplemented with aTc to induce expression of dcas9, as indicated. (E) BW25113 derivative cells deleted of rseA or both rseA and dolP were transformed with an empty vector (pCtrl) or a plasmid encoding DolP (pDolPHis). Ectopic expression of DolPHis was driven by the leaky transcriptional activity of Ptrc in the absence of IPTG. (D and E) Ten-fold serial dilutions of the indicated transformants were spotted on LB agar.


