. 2021 Apr 13;10:e67817. doi: 10.7554/eLife.67817

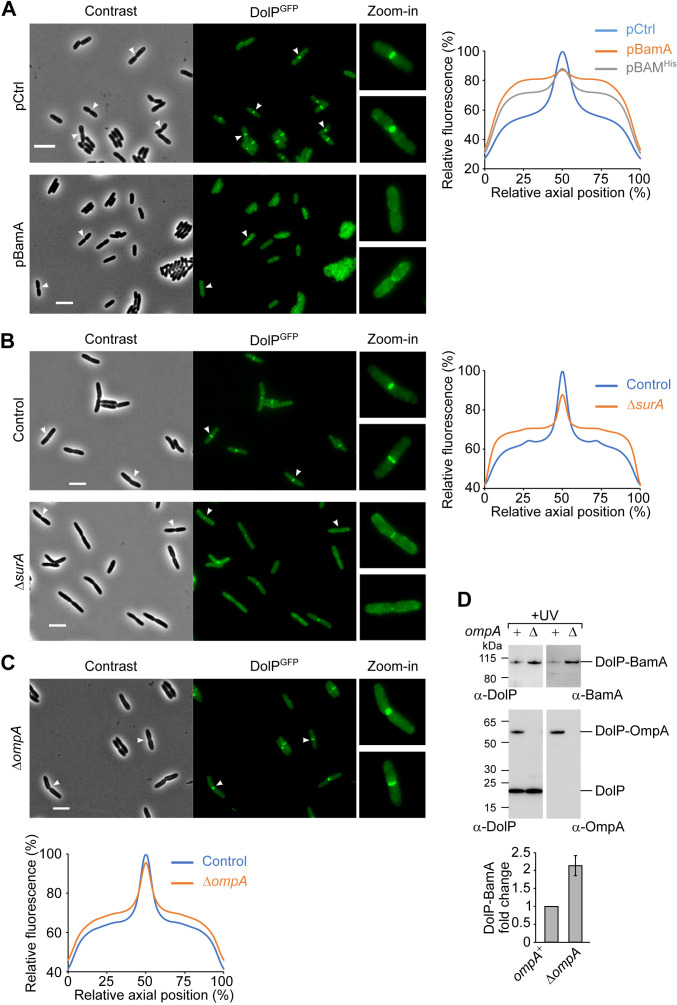
Figure 5. BamA overaccumulation in the OM and envelope stress interfere with the mid-cell localization of DolP.

(A) Overnight cultures of BW25113 cells harbouring the chromosomal fusion dolP-gfp and transformed with either pCtrl (empty vector) or pBamA were freshly diluted in minimal M9 medium, incubated at 30°C until OD600 = 0.1 and supplemented with 400 μM IPTG for 1 hr. Cell samples were visualized on 1% (w/v) agarose pads by phase contrast and fluorescence microscopy. Arrowheads indicate envelope constriction sites between forming daughter cells. Bar = 5 μm. The collective profiles of fluorescence distribution versus the relative position along the cell axis were plotted: pCtrl, blue; pBamA, orange; pBAMHis, grey (images of cells transformed with pBAMHis are shown in Figure 5—figure supplement 3A). Only cells with a constriction (N = 361, pCtrl; N = 187, pBamA; N = 187, pBAMHis) were taken into account for the collective profile plots. Fluorescence intensities were normalized to the mid-cell value obtained for the control sample. (B) Overnight cultures of BW25113 (control) or ΔsurA derivative cells carrying the dolP-gfp chromosomal fusion were freshly diluted in LB medium and incubated at 30°C until OD600 = 0.3. Cell samples were visualized as in (A). Bar = 5 μm. The collective profiles of fluorescence distribution versus the relative position along the cell axis is shown for ΔsurA cells (orange) and surA+ control cells (blue). Only cells with a constriction (N = 318, Control; N = 320, ΔsurA) were taken into account for the collective profile plots. Fluorescence intensities were normalized to the mid-cell value obtained for the control sample. (C) Overnight cultures of ΔompA cells carrying the dolP-gfp chromosomal fusion were cultured and visualized as in (B). Bar = 5 μm. The collective profiles of fluorescence distribution versus the relative position along the cell axis is shown for ΔompA cells (orange) and an ompA+ (control) strain that was cultured and visualized in a parallel experiment (blue). Only cells with a constriction (N = 287, Control; N = 193, ΔompA) were taken into account for the collective profile plots. Fluorescence intensities were normalized to the mid-cell value obtained for the control sample. (D) UV photo-crosslinking of ΔdolP and ΔdolP ΔompA cells transformed with pBamA-DolPHis harbouring an amber codon at position V52 of the dolP ORF. Signals obtained with the anti-BamA antiserum were quantified and showed in the histogram. The amount of DolP-BamA crosslink product obtained with samples lacking OmpA is expressed as fold change of the amount of the same product obtained in samples expressing OmpA. Data are reported as mean ± SEM (N = 3).

Figure 5.

Figure 5—figure supplement 1. Effect of the lack or the overproduction of DolP on BAM localization.
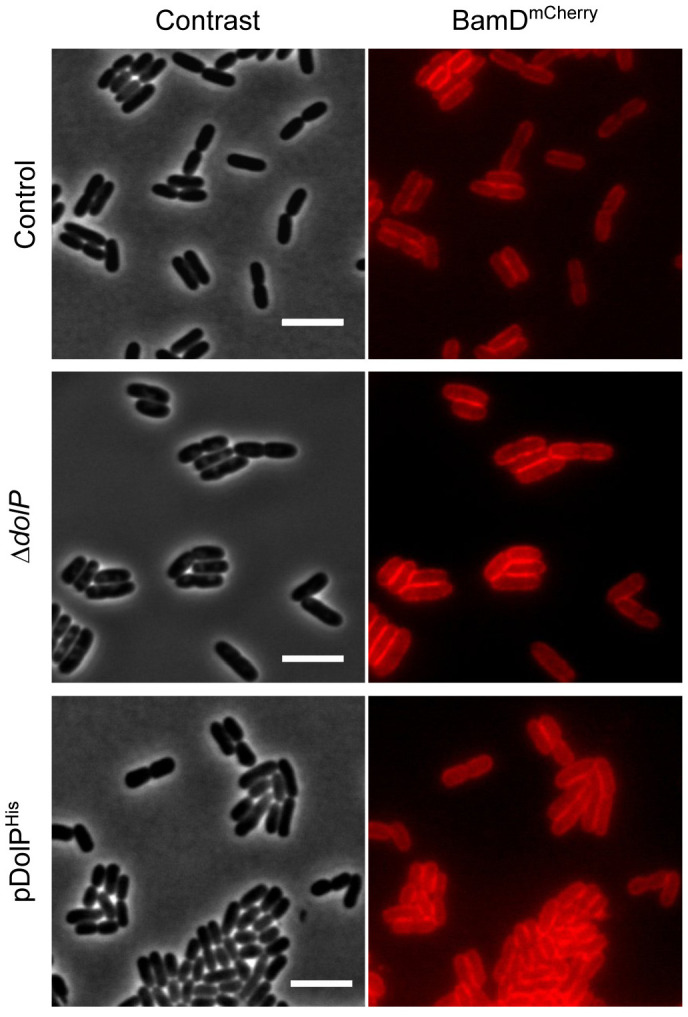
Figure 5—figure supplement 1.

BW25113 derivative cells harbouring a bamD-mCherry chromosomal fusion were visualized on 1% (w/v) agarose pads by fluorescence and phase-contrast microscopy. Top: dolP+ cells (control); Centre: ΔdolP cells: Bottom: dolP+ cells carrying pDolPHis. Cells were cultured at 30°C in minimal M9 medium to OD600 = 0.5. IPTG (400 μM) was supplemented for 1 hr to induce ectopic expression of DolPHis. Bar = 5 μm.
Figure 5—figure supplement 2. DolPGFP, NlpDmCherry, and ZipAmCherry mid-cell localization patterns.
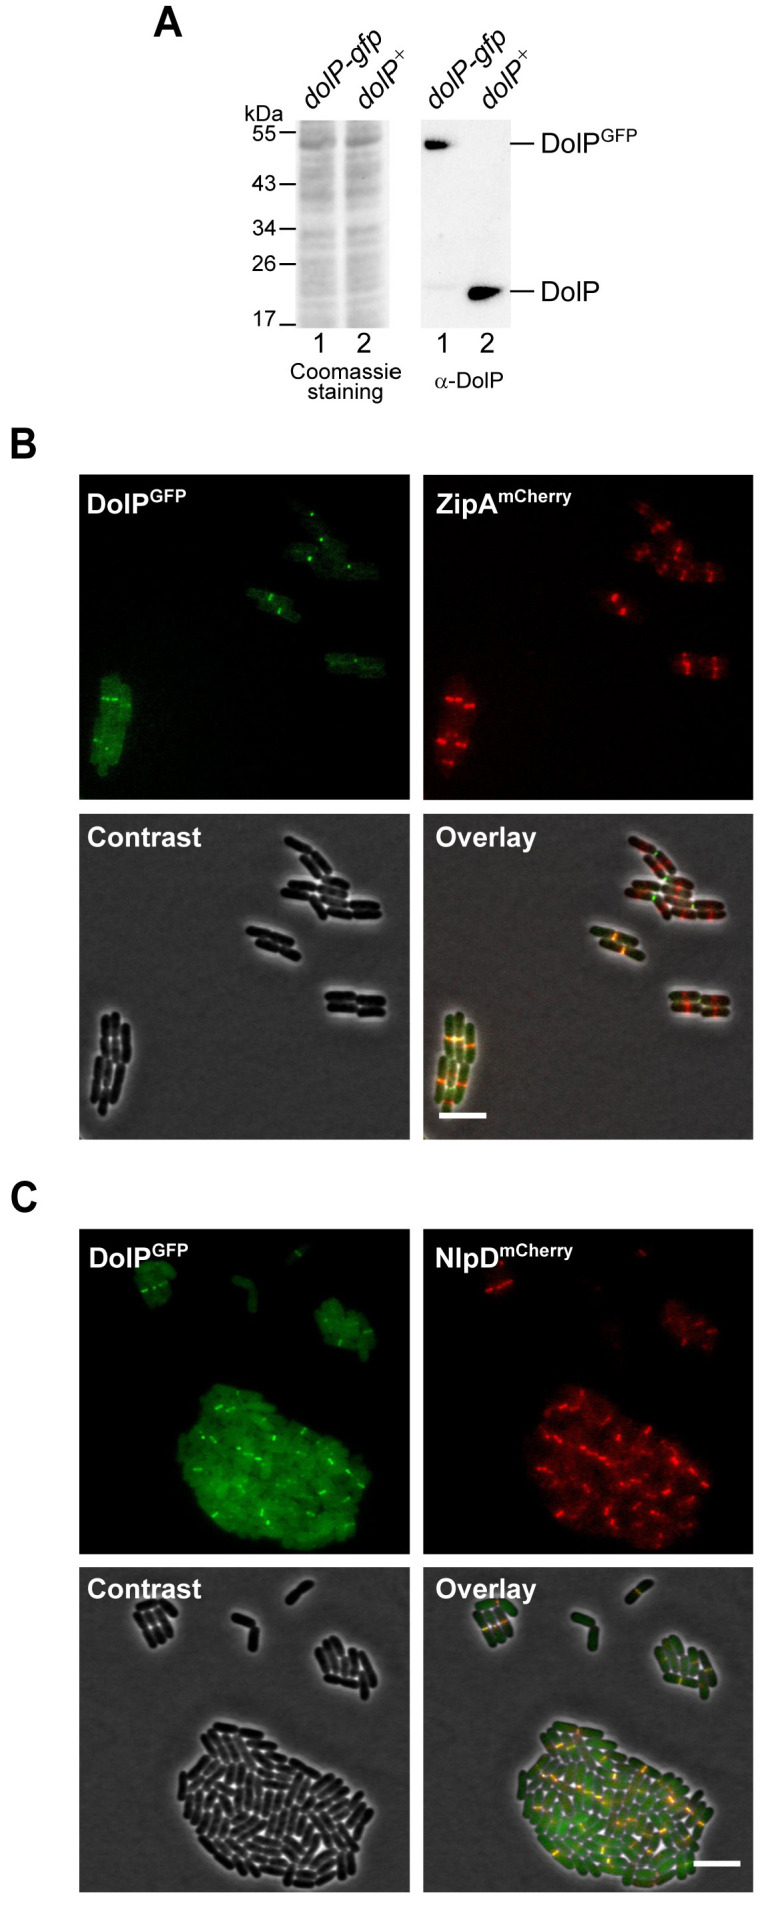
Figure 5—figure supplement 2.

(A) The total protein contents of cells harbouring the dolP-gfp chromosomal fusion (lane 1) or wild-type dolP (lane 2) were analysed by SDS-PAGE followed by coomassie staining or immunoblotting using a DolP-specific antiserum. (B and C) BW25113-derivative cells harbouring the chromosomal fusion dolP-gfp and either zipA-mCherry (B) or nlpD-mCherry (C) were cultured at 30°C in minimal M9 medium to OD600 = 0.2–0.3 and visualized on 1% (w/v) agarose pads by fluorescence and phase-contrast microscopy. Bar = 5 μm.
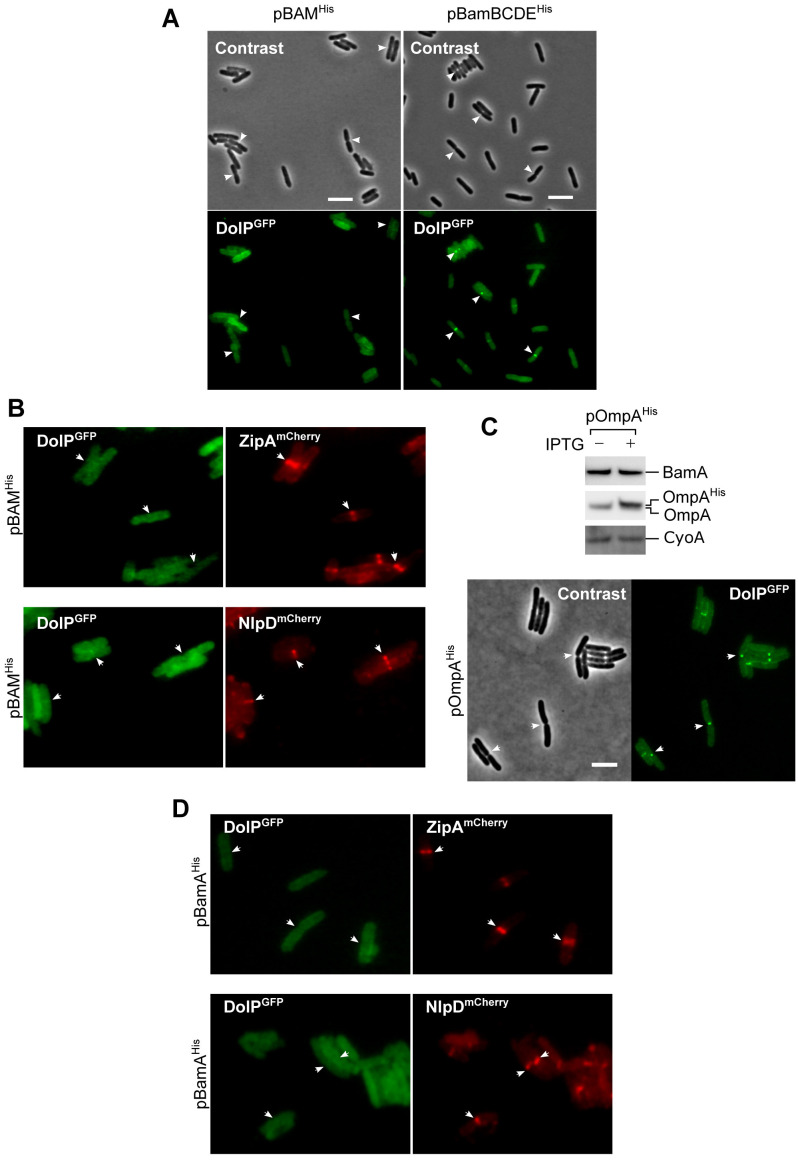
Figure 5—figure supplement 3. Overproduction of BAM influences septal recruitment of DolPGFP but not NlpDmCherry or ZipAmCherry.

Figure 5—figure supplement 3.

(A) BW25113 cells harbouring the chromosomal fusion dolP-gfp transformed with either pBAMHis or pBamBCDEHis were freshly diluted in minimal M9 medium, incubated at 30°C until OD600 = 0.1 and supplemented with 400 μM IPTG for 1 hr. Cell samples were visualized on 1% (w/v) agarose pads by phase contrast and fluorescence microscopy. Arrowheads indicate envelope constriction sites between forming daughter cells. Bar = 5 μm. The collective profiles of fluorescence distribution in cells transformed with pBAMHisare shown in Figure 5A. (B) BW25113-derivative cells harbouring the chromosomal fusion dolP-gfp and zipA-mCherry or nlpD-mCherry were transformed with pBAMHis (ectopic overproduction of all BAM subunits). Cells were then cultured at 30°C in minimal M9 medium supplemented with 400 μM IPTG for 1 hr until OD600 = 0.2–0.3, and visualized as in (A). The arrowheads indicate the localization of DolPGFP, ZipAmCherry, or NlpDmCherry at division septa. (C) Top: A BW25113-derivative dolP-gfp strain transformed with pOmpAHis was cultured in LB medium and supplemented with 400 μM IPTG or no IPTG for 1 hr prior to collecting cells. The total protein contents were analysed by SDS-PAGE and immunoblotting using the indicated antisera. Bottom: BW25113-derivative dolP-gfp cells transformed with pOmpAHis were cultured in minimal M9 medium supplemented with 400 μM IPTG for 1 hr until OD600 = 0.2–0.3, and visualized as in (A). Bar = 5 μm. (D) BW25113-derivative cells harbouring the chromosomal fusion dolP-gfp and zipA-mCherry or nlpD-mCherry were transformed with pBamAHis (ectopic overproduction of a partially inactive His-tagged form of BamA). Cells were then cultured at 30°C in minimal M9 medium supplemented with 400 μM IPTG for 1 hr until OD600 = 0.2–0.3, and visualized as in (A).
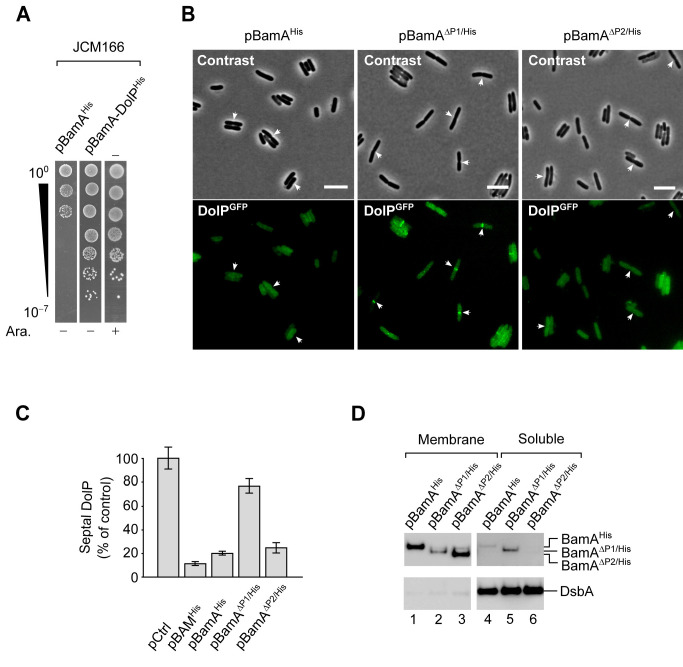
Figure 5—figure supplement 4. BamA overaccumulation in the OM impairs mid-cell localization of DolPGFP.

Figure 5—figure supplement 4.

(A) The JCM166 BamA depletion strain or its transformants carrying plasmids encoding BamAHis or wild-type BamA and DolPHis were cultured in the presence of 0.02% (w/v) arabinose (which induces transcription of a chromosomal copy of wild-type bamA engineered downstream of an arabinose-inducible Pbad promoter). Serial dilutions were spotted on LB agar devoid of or supplemented with 0.02% (w/v) arabinose, as indicated. In the absence of arabinose, growth is supported by the ectopic expression of wild-type BamA and not of its variant encoding C-terminally His-tagged BamA. (B) Overnight cultures of BW25113 cells harbouring the chromosomal dolP-gfp fusion and carrying the indicated plasmids were diluted in minimal M9 medium supplemented with 400 μM IPTG. The cells were grown at 30°C to OD600 = 0.2–0.3 and visualized on 1% (w/v) agarose pads by fluorescence microscopy. The arrows indicate envelope constriction sites between forming daughter cells. Bar = 5 μm. (C) Counting of BW25113 cells presenting septal DolPGFP fluorescent signals. dolP-gfp cells carrying pBAMHis, pBamAHis, pBamAΔP1/His, or pBamAΔP2/His (analysed by fluorescence microscopy and shown in Figure 5—figure supplements 3A and B) were counted. The percentage of cells presenting fluorescent DolPGFP signals at the mid-cell in samples overproducing all five BAM subunits or only one of the indicated BamA variants was normalized to the same fraction obtained for cells carrying the control empty vector (pCtrl). Bar charts display a mean value ± SD (N = 3). More than 300 cells were counted in each experiment. (D) BW25113 cells carrying the indicated plasmids were cultured and supplemented with 400 μM IPTG to induce ectopic expression of BamAHis and its mutant forms. Collected cells were subjected to lysozyme/EDTA lysis to obtain the total membrane and soluble fractions. The protein contents of the indicated cell fractions were separated by SDS-PAGE and immunolabelled with the indicated antisera.
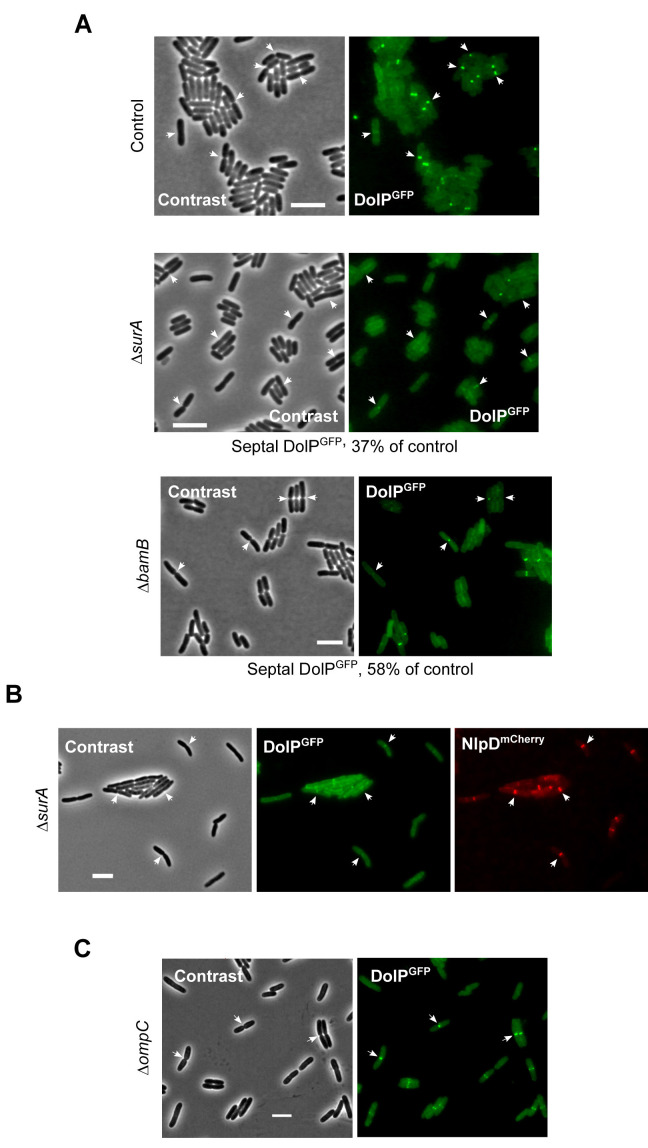
Figure 5—figure supplement 5. Envelope stress influences the localization of DolPGFP.

Figure 5—figure supplement 5.

(A) Overnight cultures of BW25113 (control) or ΔsurA or ΔbamB derivative cells carrying the dolP-gfp chromosomal fusion were freshly diluted in M9 medium and incubated at 30°C till OD600 = 0.3 and visualized on 1% (w/v) agarose pads by contrast and fluorescence microscopy. Bar = 5 μm. The arrows indicate envelope constriction sites between forming daughter cells. The percentage of cells presenting fluorescent DolPGFP signals at division septa in ΔsurA and ΔbamB cells was normalized to the same fraction obtained for the control cells and reported below the micrograph. More than 1000 (ΔsurA) and 300 (ΔbamB) cells were counted. (B) Overnight cultures of BW25113 (control) or ΔsurA derivative cells carrying the dolP-gfp and nlpD-mCherry chromosomal fusions were freshly diluted in LB medium and incubated at 30°C until OD600 = 0.3 prior to visualization by contrast and fluorescence microscopy. Bar = 5 μm. The arrows indicate envelope constriction sites between forming daughter cells. (C) Overnight cultures of ΔompC cells harbouring the chromosomal dolP-gfp fusion were diluted in minimal M9 medium, cultured at 30°C to OD600 = 0.3 and visualized on 1% (w/v) agarose pads by contrast and fluorescence microscopy. The arrows indicate envelope constriction sites between forming daughter cells. Bar = 5 μm.