. 2021 Mar 25;10:e64774. doi: 10.7554/eLife.64774

Figure 3. Comparing taxonomic classification on genus rank for replicating cells in agar plate and in-droplet cultivation.

(A) Triangles depict the relative abundances for genera in eight biological replicates per droplet and plate cultivation method. Underlying boxplots show the distribution of data points. Relative abundances of operational taxonomic units (OTU) (evolutionary distance of 0.03) were agglomerated on the genus level (evolutionary distance of 0.1). Displayed are the 10 most abundant genera of in total 238 assigned genera covering 66.8% of all sequences. The 30 most abundant genera covering a total of almost 90% are shown in Figure 3—figure supplement 5. Means of relative abundances were compared by Wilcoxon rank-sum test for each genus (α = 0.05), applying Holm–Bonferroni correction for multiple comparisons. Adjusted p-values are displayed. As effect size, Cohen’s d was computed and plotted as bars to indicate which differences are practically relevant. The direction and the color of the bars depend on the sample type in which the larger mean was found (blue – larger mean in plate samples, green – larger mean in droplet samples). (B) Venn diagram for the taxa on genus level. Of 238 assigned genera, 142 were found in both cultivation methods while 93 were unique to droplet cultivation and three were only observed in plate cultivation. The area of the Venn elements corresponds to the total number of genera found for the cultivation techniques. (C) Venn diagram for the OTU level. Of 1687 OTUs, 677 were found in both cultivation methods, 983 were unique to droplets, and 27 were unique to plates. The area of the Venn elements corresponds to the total number of OTUs found for the cultivation techniques.

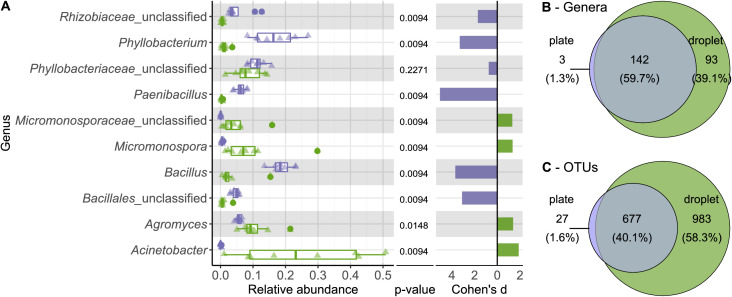
Figure 3—source code 1. Source code for generation of (A) in Figure 3.
Figure 3—source code 2. Source code generating Figure 3—source data 2 and 3.
Taxa lists are used to generate Venn diagram in Figure 3B.
Figure 3—source code 3. Source code generating Figure 3—source data 4 and 5.
Taxa lists are used to generate Venn diagram in Figure 3C.
Figure 3—source data 1. Source data for all panels in Figure 3.
Figure 3—source data 2. Source data generated from Figure 3—source data 1 containing all droplets genera for Figure 3B.
Figure 3—source data 3. Source data generated from Figure 3—source data 1 containing all plate genera for Figure 3B.
Figure 3—source data 4. Source data generated from Figure 3—source data 1 containing all droplet operational taxonomic units for Figure 3C.
Figure 3—source data 5. Source data generated from Figure 3—source data 1 containing all plate operational taxonomic units for Figure 3C.

Figure 3.

Figure 3—figure supplement 1. Comparing taxonomic classification on phylum rank for replicating cells in agar plate and in-droplet cultivation.

Figure 3—figure supplement 1.

Boxplots depict the distribution of relative abundances for phyla in droplet and plate cultivation samples. Relative abundances of operational taxonomic units were agglomerated on the phylum level. Displayed are 13 assigned phyla covering 100% of all sequences. Means of relative abundances were compared by Wilcoxon rank-sum test for each phylum (α = 0.05), applying Holm–Bonferroni correction for multiple comparisons. ** Significant with p<0.01, * significant with p<0.05. As effect size, Cohen's d was computed and plotted as bars to indicate which differences are practically relevant. The direction and the color of the bars depend on the sample type in which the larger mean was found (blue – larger mean in plate samples, green – larger mean in droplet samples).
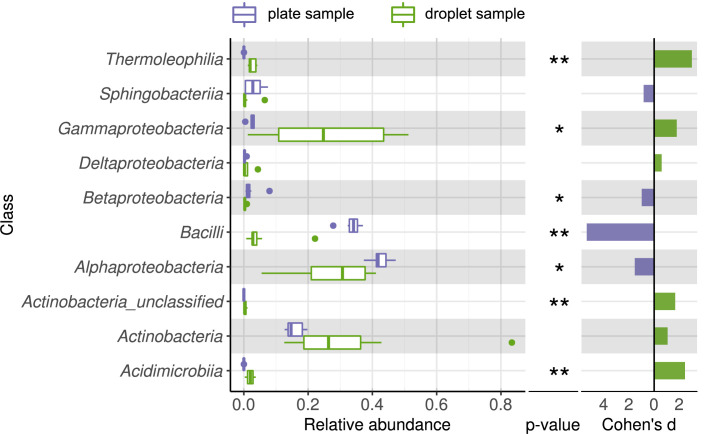
Figure 3—figure supplement 2. Comparing taxonomic classification on class rank for replicating cells in agar plate and in-droplet cultivation.

Figure 3—figure supplement 2.

Boxplots depict the distribution of relative abundances for phyla in droplet and plate cultivation samples. Relative abundances of operational taxonomic units were agglomerated on the class level. Displayed are the 10 most abundant classes of in total 41 assigned classes covering 99.42% of all sequences. Means of relative abundances were compared by Wilcoxon rank-sum test for each class (α = 0.05), applying Holm–Bonferroni correction for multiple comparisons. ** Significant with p<0.01, * significant with p<0.05. As effect size, Cohen's d was computed and plotted as bars to indicate which differences are practically relevant. The direction and the color of the bars depend on the sample type in which the larger mean was found (blue – larger mean in plate samples, green – larger mean in droplet samples).
Figure 3—figure supplement 3. Comparing taxonomic classification on order rank for replicating cells in agar plate and in-droplet cultivation.

Figure 3—figure supplement 3.

Boxplots depict the distribution of relative abundances for phyla in droplet and plate cultivation samples. Relative abundances of operational taxonomic units were agglomerated on the order level. Displayed are the 20 most abundant orders of in total 72 assigned orders covering 99.03% of all sequences. Means of relative abundances were compared by Wilcoxon rank-sum test for each order (α = 0.05), applying Holm–Bonferroni correction for multiple comparisons. ** Significant with p<0.01, * significant with p<0.05. As effect size, Cohen's d was computed and plotted as bars to indicate which differences are practically relevant. The direction and the color of the bars depend on the sample type in which the larger mean was found (blue – larger mean in plate samples, green – larger mean in droplet samples).
Figure 3—figure supplement 4. Comparing taxonomic classification on family rank for replicating cells in agar plate and in-droplet cultivation.

Figure 3—figure supplement 4.

Boxplots depict the distribution of relative abundances for phyla in droplet and plate cultivation samples. Relative abundances of operational taxonomic units were agglomerated on the family level. Displayed are the 30 most abundant classes of in total 144 assigned families covering 96.37% of all sequences. Means of relative abundances were compared by Wilcoxon rank-sum test for each family (α = 0.05), applying Holm–Bonferroni correction for multiple comparisons. ** Significant with p<0.01, * significant with p<0.05. As effect size, Cohen's d was computed and plotted as bars to indicate which differences are practically relevant. The direction and the color of the bars depend on the sample type in which the larger mean was found (blue – larger mean in plate samples, green – larger mean in droplet samples).
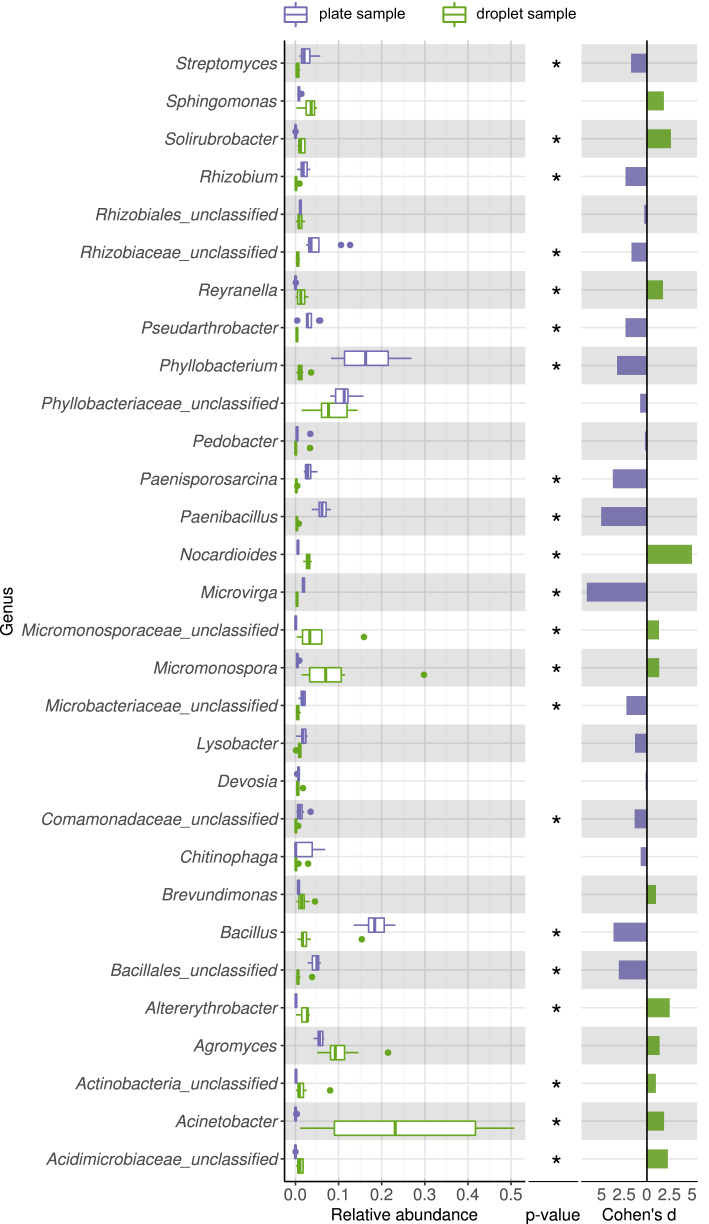
Figure 3—figure supplement 5. Comparing taxonomic classification on genus rank for replicating cells in agar plate and in-droplet cultivation.

Figure 3—figure supplement 5.

Boxplots depict the distribution of relative abundances for phyla in droplet and plate cultivation samples. Relative abundances of operational taxonomic units were agglomerated on the genus level. Displayed are the 30 most abundant genera of in total 240 assigned genera covering 89.54% of all sequences. Means of relative abundances were compared by Wilcoxon rank-sum test for each genus (α = 0.05), applying Holm–Bonferroni correction for multiple comparisons. ** Significant with p<0.01, * significant with p<0.05. As effect size, Cohen's d was computed and plotted as bars to indicate which differences are practically relevant. The direction and the color of the bars depend on the sample type in which the larger mean was found (blue – larger mean in plate samples, green – larger mean in droplet samples).
Figure 3—figure supplement 6. Detailed view into exclusive and uncultured taxa found in droplets or on plates.

Figure 3—figure supplement 6.

(A) Overview of taxa that were exclusively found in droplet samples and/or plate samples with taxonomic classification on the phylum level. (B) Overview of the exclusive taxa that were classified as uncultured found in droplet and/or plate samples. Taxa that were unclassified on the genus level and likely belong to the uncultured category were not considered for this comparison.