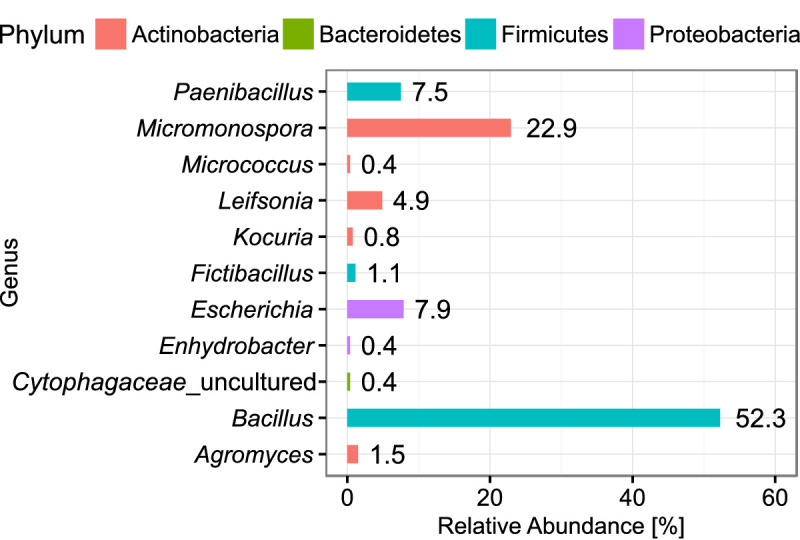
Figure 5. Abundance of classified bacterial isolates obtained from droplet cultivation.

The distribution of abundance on the genus rank is displayed. Colors of the bars indicate the affiliation to phyla. Each bar is labeled with its exact relative abundance.
